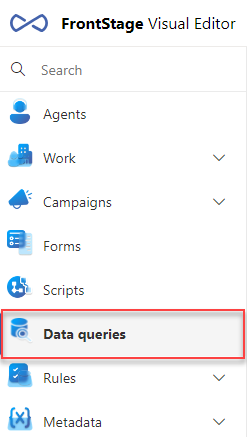
Data queries
The editor can be found in FrontStage administration. You need the EditQuery role.
Note
If the user has assigned the role EditQuery at leats on AllowRead level, new button will appear within data grids, for opening the editor, located in lower bar

The running editor displays a list of all existing queries. It is also filled with the result of the data query. Its ID is in the QueryAdminQueryId configuration parameter.
In the upper right corner there are buttons for interacting with the records:
Create - Displays a dialog for creating a query header.
Copy - Creates a copy of the query marked in the list.
Delete - Deletes the marked records in the list.
Reset selected perf. counter - Reset all counters at once. To use this button, you need the
DiagAdminrole with at least the AllowWrite level.Export - Exports tagged records in JSON format.
Usage list - Option to assign specific queries to application functions. The query will then populate the functionality with its data.
Usage Matrix - Functions like List, but different display.
Save
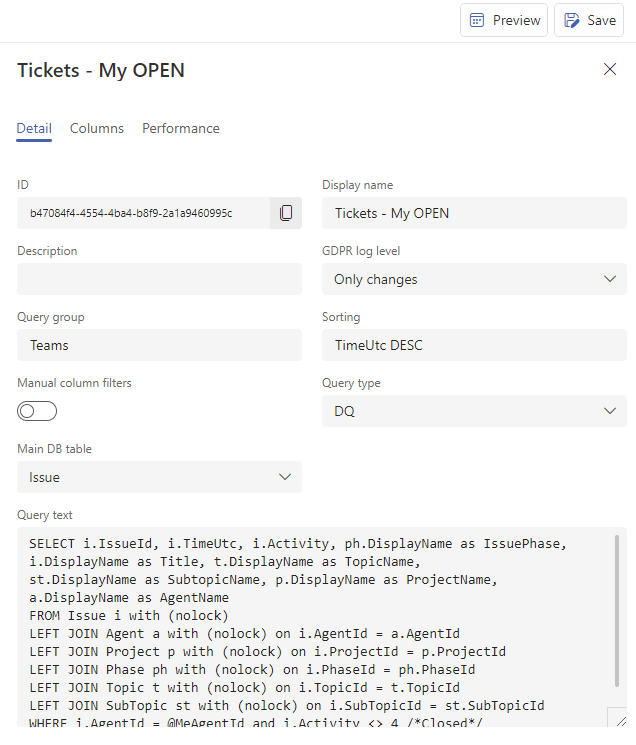
The Detail tab
ID - System generated GUID.
Display Name - You have filled it in before, editable.
Description - Advanced description/note.
GDPR log level.
Query group
Sorting
The name of the query column by which the records will be sorted. Must correspond to the Target column name value for a specific existing column on the same page.
You can enable sorting by multiple columns, names separated by a comma, e.g., “SpecificName, DisplayName”.
You can force the sorting direction: “DESC” for descending, “ASC” for ascending. E.g.: “TimeUtc DESC”.
Manual column filters
Query type
DQ - common data query (always executed against the database)
Snapshot - it is executed once, and then the data is returned unchanged for a certain period
Timeline - is executed periodically; only the first line is taken and added to the set
Cache
Main DB table
Note
The permission to create and modify the query text is controlled by the DataQuery role.
The subfolder contains a Preview button that you can use to view and debug the query continuously.
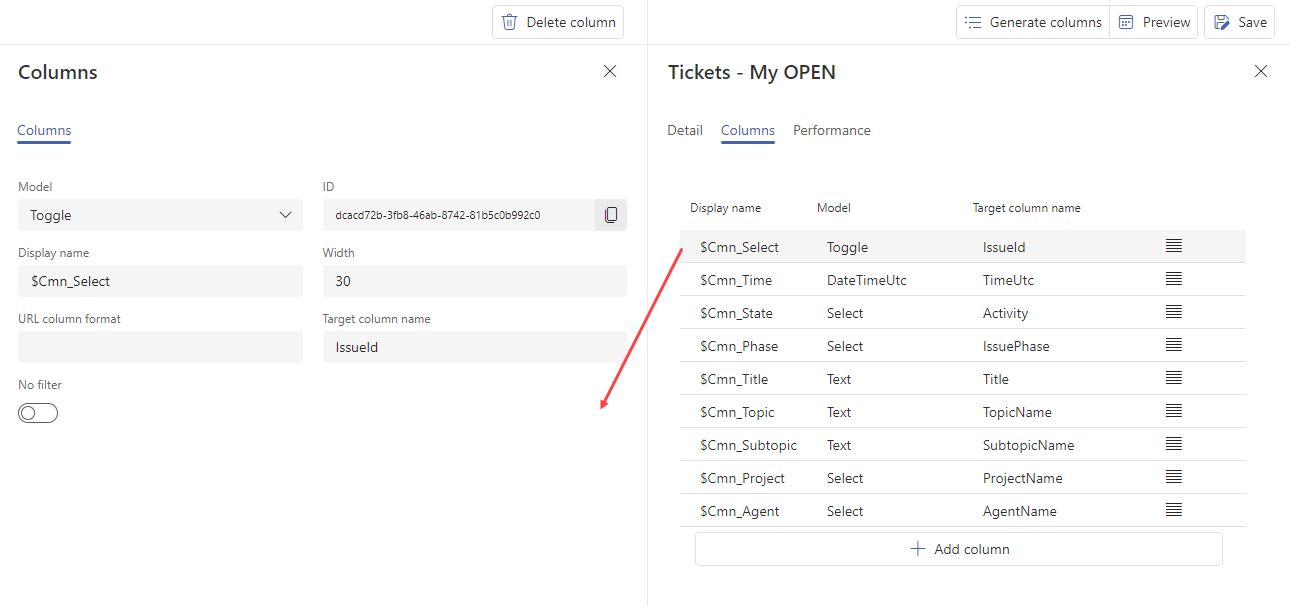
Columns tab
List and settings of columns for grid needs. You can create one at a time using Add column or all at once using Generate columns.
You can edit the detail for each column:
Rank - Ordering of columns in lists and displayed grid.
Width - Rendered width.
Name - Displayed name in the grid. To localize it, you need to write it as a variable starting with “$” - e.g., “$Cmn_State”. Variables can be found or created in the
LiteralLookupdatabase table.Target column name - Must correspond with the name of the specific column written in the SQL query on the Detail page, this will link it.
Model - Specifies the value representation provided by the column. Based on the model selection, additional column setup items are displayed.
Performance tab
Při práci s tabulkami se spouštějí datové dotazy, které vracejí požadované informace z databáze. Některé tabulky se používají a refreshují častěji, některé méně často. Některé tabulky vracejí data svižně, některé je mohou vracet s velkou prodlevou. Ve chvíli, kdy se zobrazení dat začne výrazně zpomalovat, na této stránce je možné zjistit, které tabulky jsou používány nejčastěji, které zobrazují požadovaná data s největším zpožděním, které vykazují při zobrazování dat chybovost a které z nich nejvíce.
This page allows you to optimize your data display by identifying problematic data queries and taking required action.
After performing the necessary analyses, you can optimize your data display in several ways:
Edit query
Increase the interval for automatic data refreshing
Set the portlet to display data in the grid only after selecting one of the filters
On the start page in the query list (with the default settings), the columns with performance information are as follows:
Type – Query type
 Common data query – Always executed against the database
 Timeline – Executed regularly; only the first line is taken and added to the set
(ms) – An average delay time in milliseconds before data was displayed (Duration/Count)
Data(N) – The number of times the table data is displayed; the tooltip displays the cumulative duration
Data(E) – error count – The value indicates the number of hard errors and timeouts in total; tooltip shows only hard errors (e.g. a syntax error in query, failed to connect to database, etc.)
Important
To view this information, you must have the DiagAdmin role with at least the AllowRead level.