Reporting
For visualization and data handling, FrontStage uses external services, which were developed right for these purposes, with the aim of maximal functionality and user-friendliness. Read more about particular services, how to use them, and what they can offer with our contact center.
Grafana
Grafana is a multiplatform analytical and interactive visualization web application. When connected to supported data sources, it provides graphs, charts and other visualizations and services.
Running reports from ReactClient
All available reports are listed within your supervisor application. To see them, open the “Reports” tab in the header. Each report has a short description of what you can expect in it. To run it, click on its name and a new window displaying the report will appear.
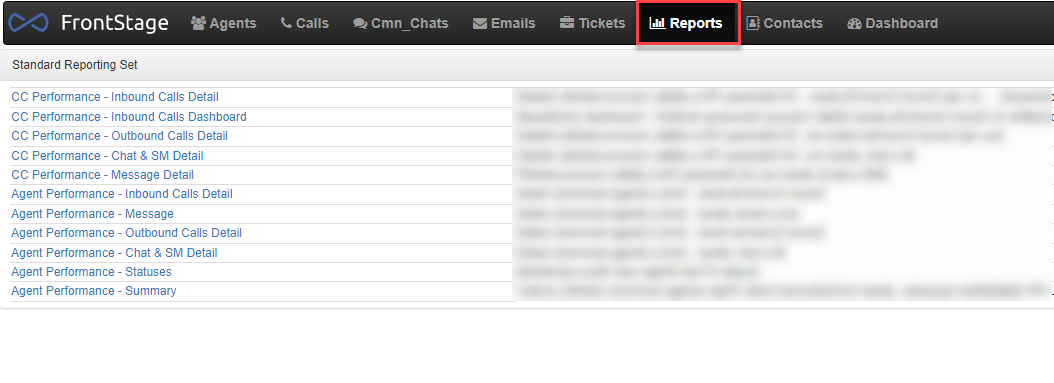
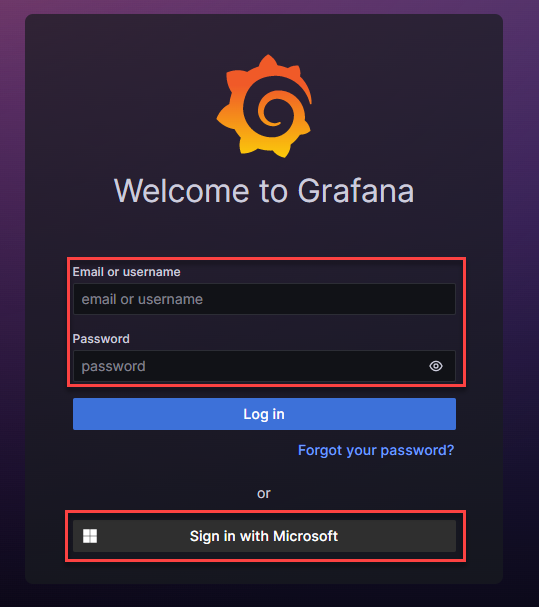
When opening reports for the first time, you have to log-in in order to use the service. You can use provided credentials or a Microsoft account. If you don’t have authorization yet, ask your administrator.
Next time, the browser should remember your credentials and you will see the report immediately.
Repot usage
A report window has three main areas:
Custom filters
Reporting tool functional buttons
Dashboard - area for the data itself, can be tables, charts, etc.
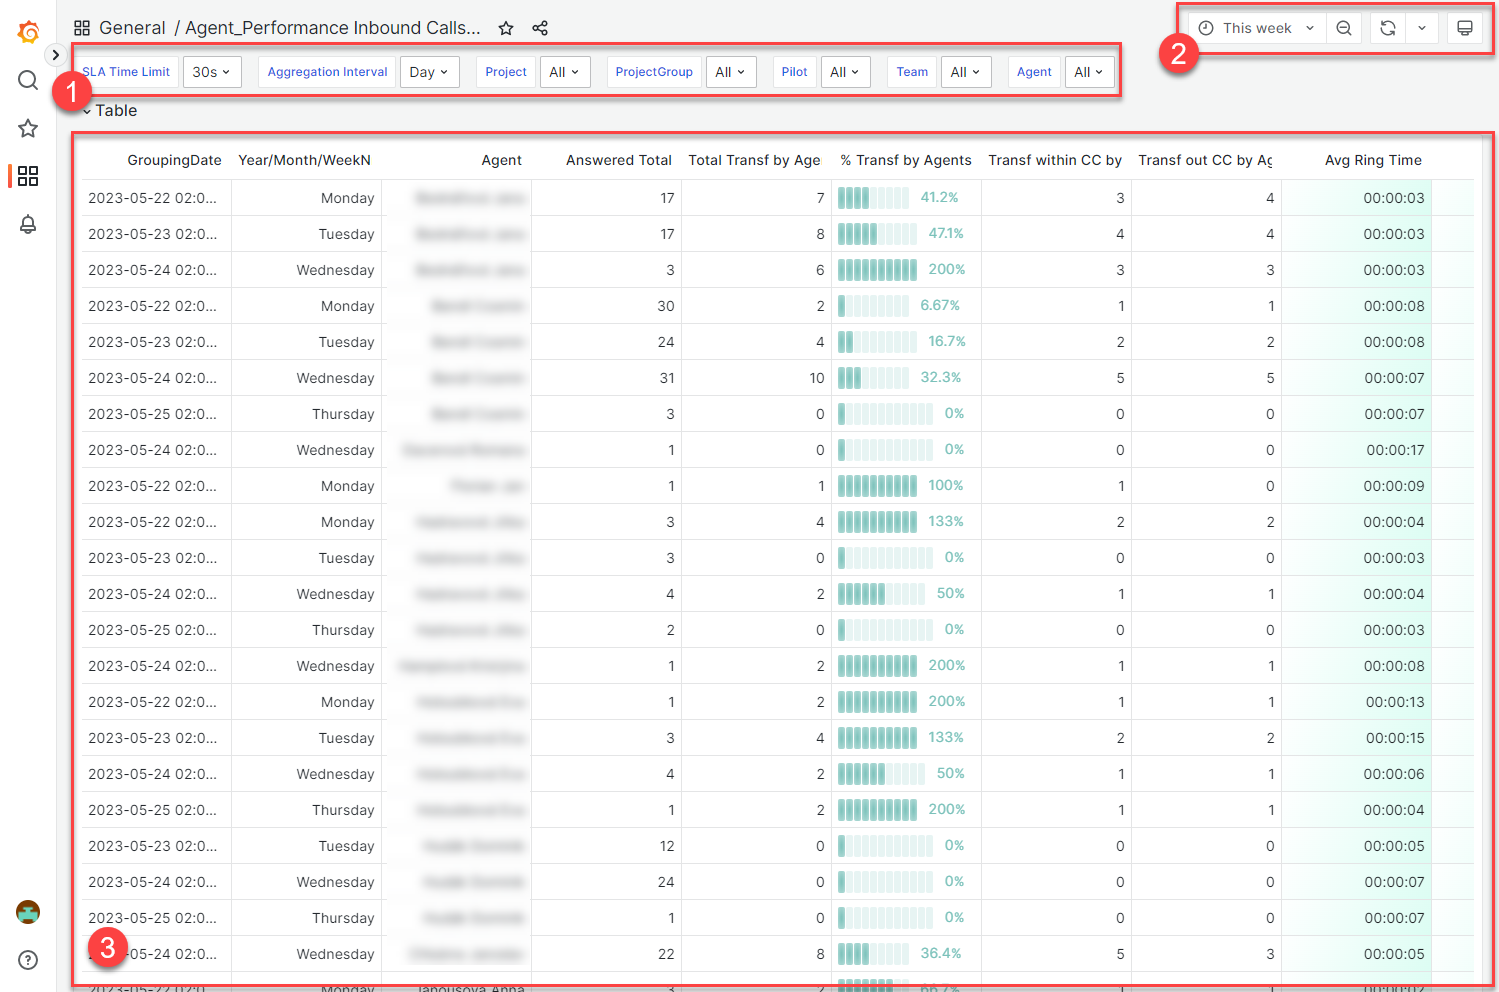
Custom filters
By using these filters, you will change the dataset grouping for rendering the tables, charts, and related calculations so you will see different output with different filters applied, because the base for the calculations was changed.
There’s always a name and currently applied value.
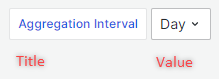
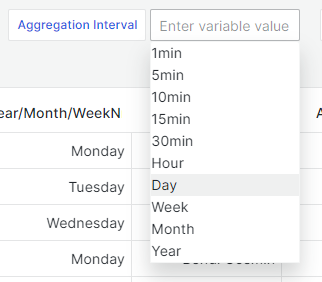
To select a new value, click on the current one to trigger a drop-down menu with available values.
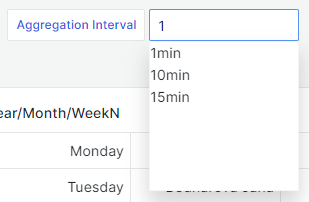
If the drop-down menu contains a lot of values and you can’t see the one you are looking for, you can try quick search, by entering even a single character, that is incorporated in your searched value.
Some filters support more values filtered at once. You can tell, if that’s the case, by the present checkboxes. Simply check every value you want to filter and then click out of the drop-down menu area. The filters will be applied.
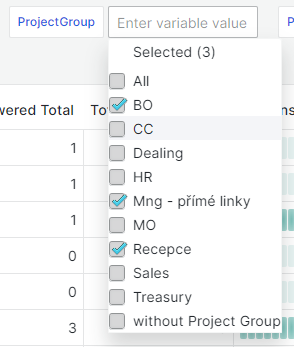
For a quick un-select, press the Selected (X) label at the top of the drop-down menu (“X” stands for number of filtered values).
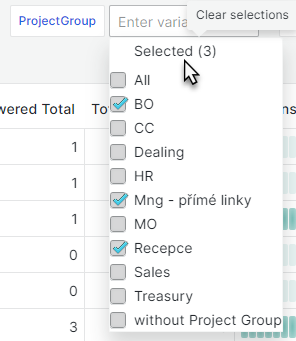
An additional function of this label is, that when none value is selected, you can press it to select all the available values at once. This might be handy when you want to filter everything except one or two values. Another press will reset the selection to none.
Important
If you change the filter values and nothing happens, e.g. the data had not been recalculated, check the Refresh dashboard
Reporting tool functional buttons
Native Grafana user interface items, which were not adjusted in any way.
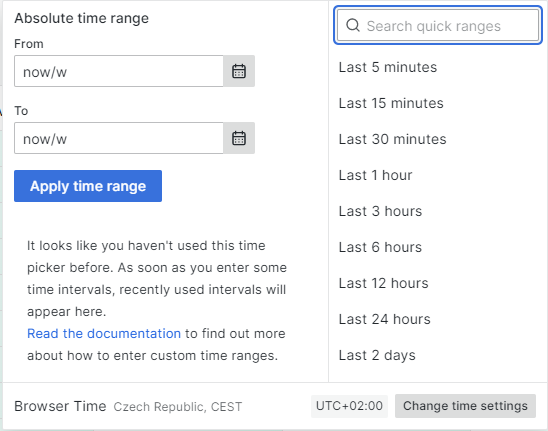
Current time range
The current time range, shows the time range currently displayed in the dashboard you are viewing. Hover your cursor over the field to see the exact time stamps in the range and their source (such as the local browser).
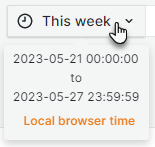
Click the current time range to change it. You can change the current time using a relative time range, such as the last 15 minutes, or an absolute time range, such as 2020-05-14 00:00:00 to 2020-05-15 23:59:59.
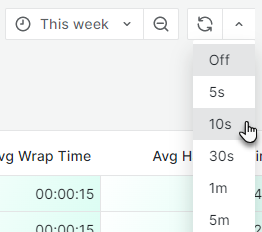
Refresh dashboard
Click the Refresh dashboard icon to immediately run every query on the dashboard and refresh the visualizations. The service cancels any pending requests when you trigger a refresh.

By default, the service does not automatically refresh the dashboard. Queries run on their own schedule according to the settings. However, if you want to regularly refresh the dashboard, then click the down arrow next to the Refresh dashboard icon and then select a refresh interval.
Dashboard
Every item on the dashboard (table or chart) has an interactive header, which offers some options:
View - displays the item in a detail
Share - shows pop-up window with share options
Inspect - lets you run a diagnostic panel, where several options are available. For our usage, the “download” option is the most useful one
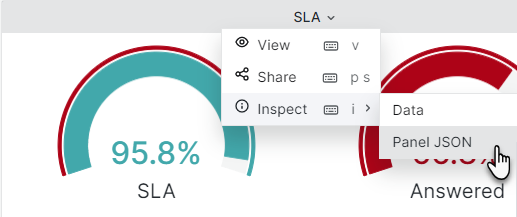
Data download
From the header, open Inspect –> Data where you will see all the data, which were used to visualise the dashboard item. Before downloading the data, you have several options to set, that can affect the download outcome.
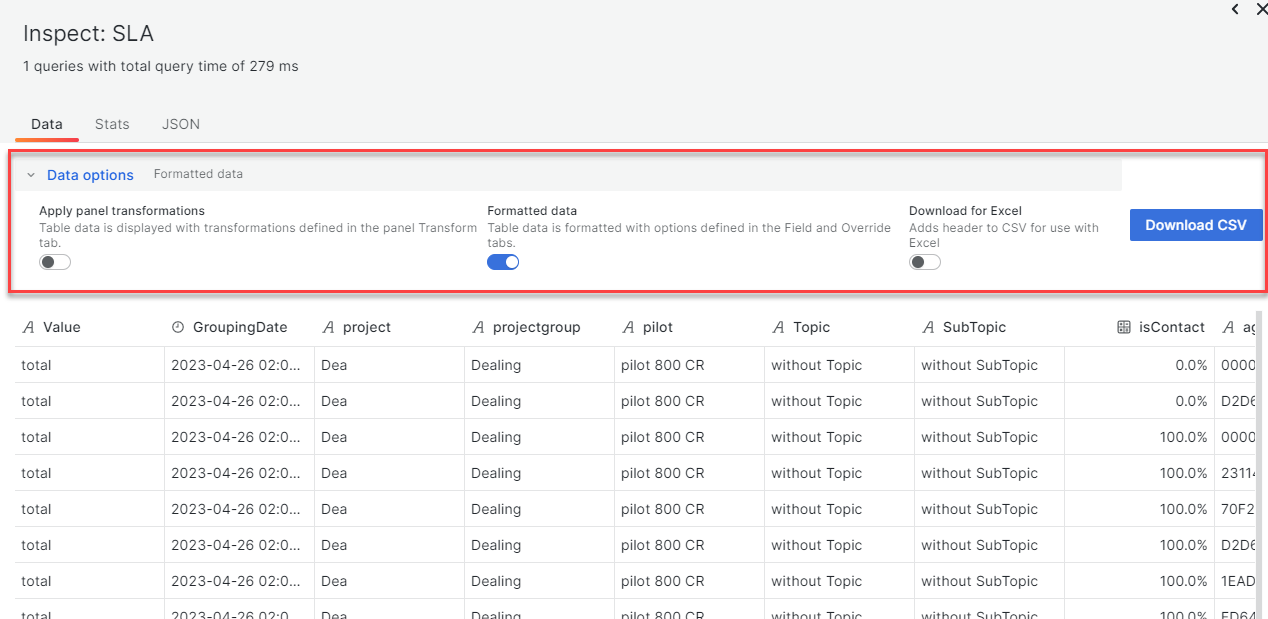
After pressing the Download CSV button, a local file will be stored to your PC.
Agent Performance reports
Set of reports that aim on agents as individuals.
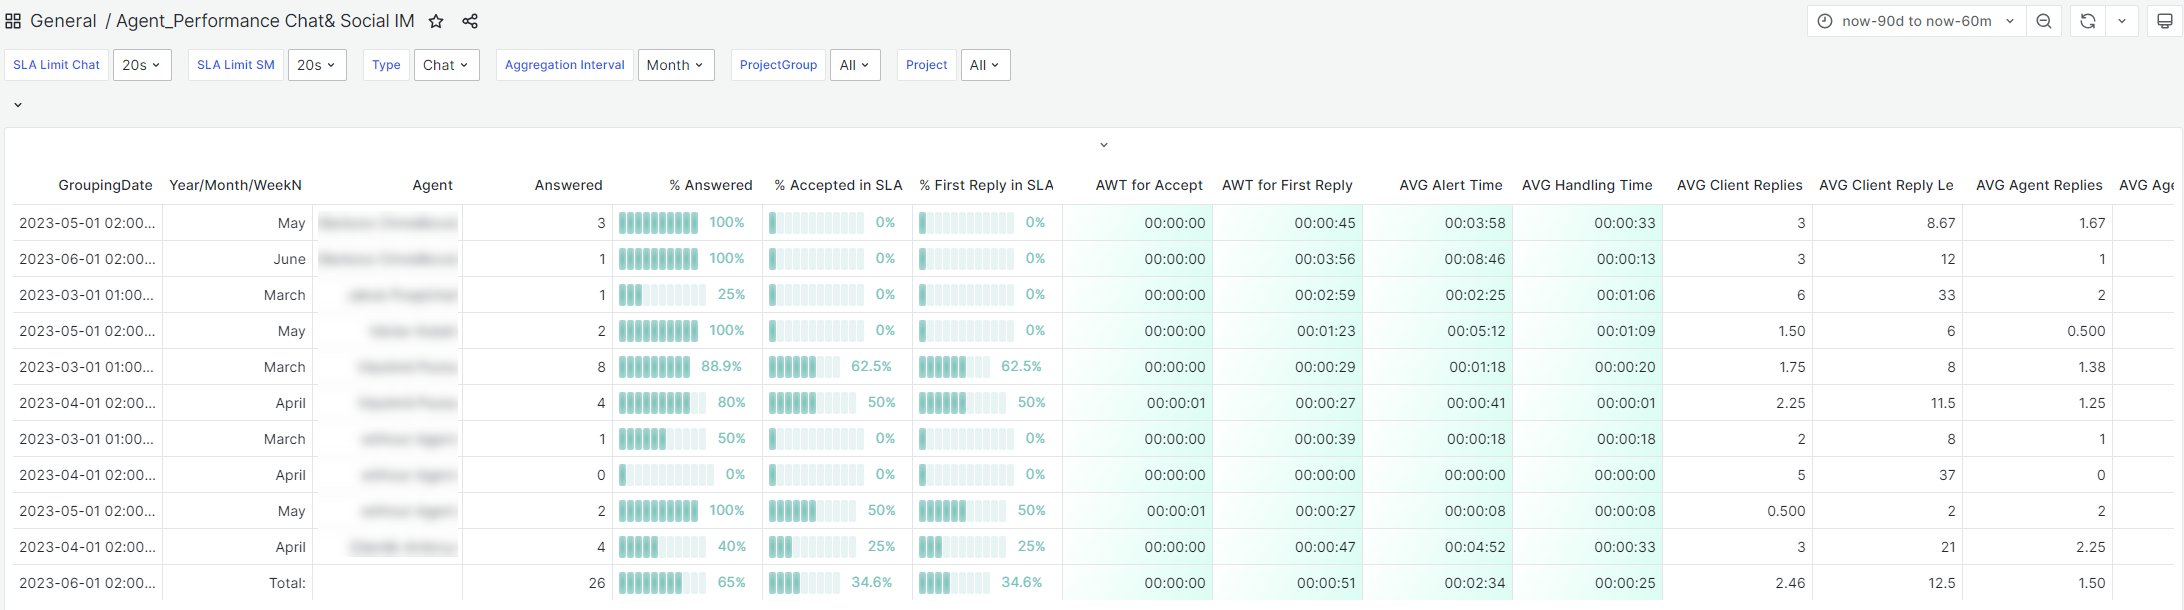
Chat and Social IM
Filters:
SLA Limit Chat - Affects SLA calculations for Chat records
SLA Limit SM - Affects SLA calculations for Social IM records
Type - displays the data according to the communication type. Chat or Social IM
Aggregation Interval - divides the data into selected period, then presented in these periods per row
ProjectGroup and Project - filters the displayed data according to inserted values
Available columns, all of them depend on the Aggregation Interval:
Column |
Explanation |
|---|---|
GroupingDate |
Day-Time/Month/ Year - depends on the parameter “Aggregation Interval” |
Year/Month/WeekN |
Day of Week name/Month name/Week number |
Answered |
All incoming conversations that were actually handled by agents |
% Answered |
% of all incoming conversations that were handled by agents |
% Accepted in SLA |
% of all incoming conversations that were accepted by agents in selected SLA time |
% First Reply in SLA |
% of all incoming conversations that were actually answered by agents in SLA time |
AWT for Accept |
The average time that conversations had been waiting until they were accepted by agents for processing |
AWT for First Reply |
The average time that clients had been waiting until they received the first reply from the agent |
AVG Alert Time |
The average alert time of all the handled conversations |
AVG Handling Time |
The average handling time of all the handled conversations |
AVG Client Replies |
The average number of messages sent by a client per handled conversation |
AVG Client Reply Length |
The average number of characters in a message, sent by a client per handled conversation |
AVG Agent Replies |
The average number of messages sent by an agent per handled conversation |
AVG Agent Reply Length |
The average number of characters in a message, sent by an agent per handled conversation |
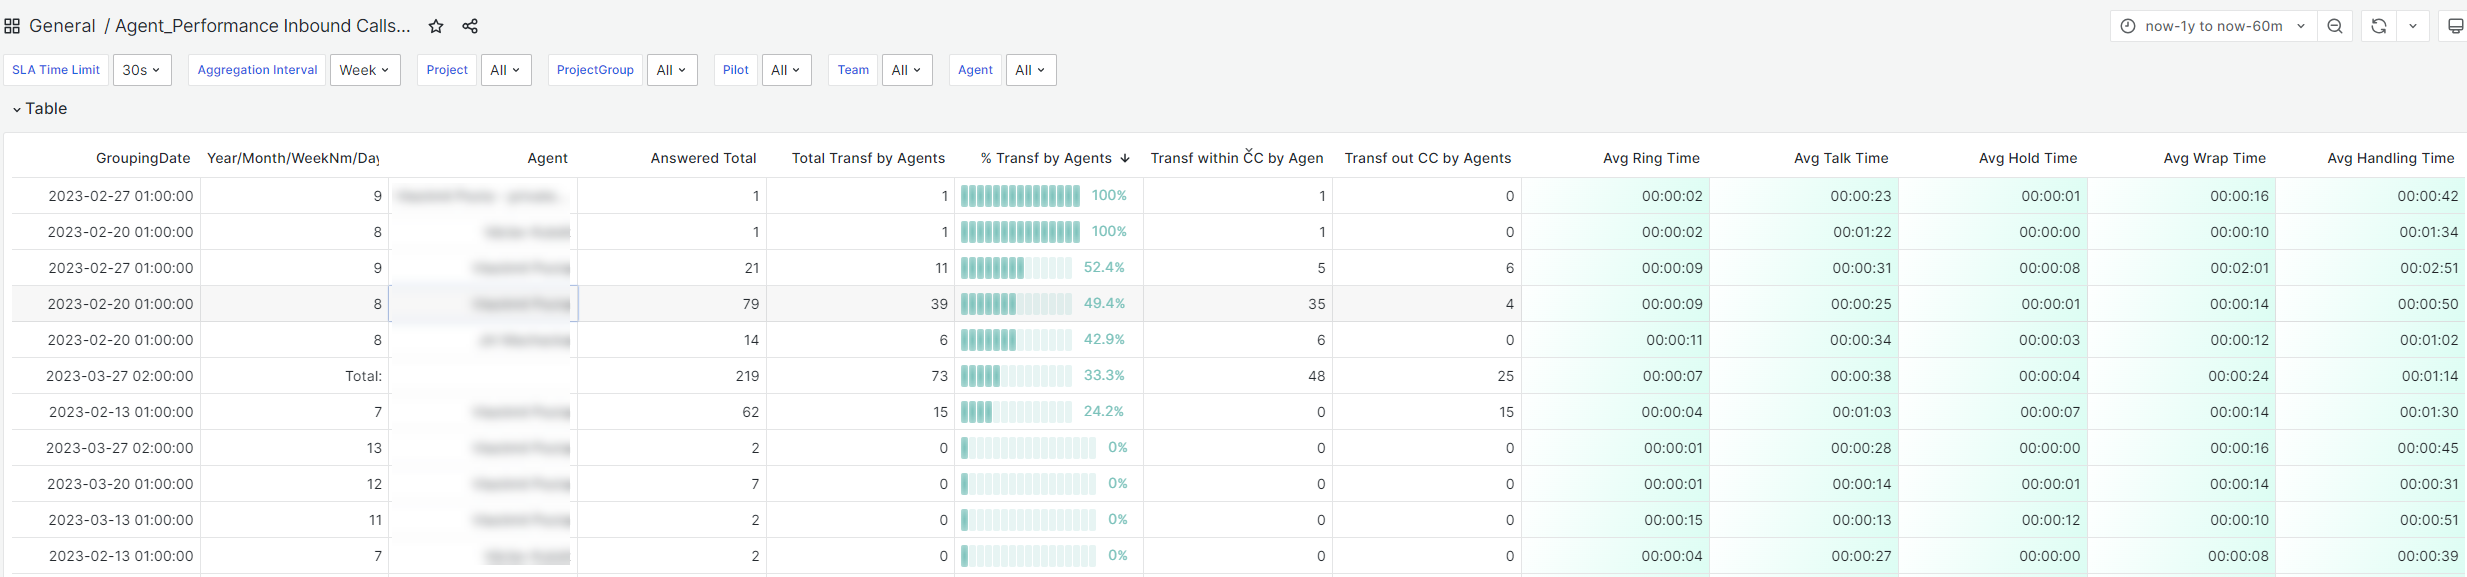
Inbound calls
Filters:
SLA Time Limit - Affects SLA calculations
Aggregation Interval - divides the data into selected period, then presented in these periods per row
ProjectGroup, Project, Pilot, Team, Agent - filters the displayed data according to inserted values
Available columns, all of them depend on the Aggregation Interval:
Column |
Explanation |
|---|---|
GroupingDate |
Day-Time/Month/ Year - depends on the parameter “Aggregation Interval” |
Year/Month/WeekN |
Day of Week name/Month name/Week number |
Answered Total |
All handled inbound calls |
Total Transf by Agents |
All inbound calls that were handled and then transferred within CC or outside CC (SUM of both) |
% Transf by Agents |
% of the calculation above from all of the inbound calls |
Transf within CC by Agent |
All inbound calls that were handled by agents and then transferred within CC |
Transf out CC by Agents |
All inbound calls that were handled by agents and then transferred outside CC |
Avg Ring Time |
Average ring time of all handled inbound calls |
Avg Talk Time |
Average talk time of all handled inbound calls |
Avg Hold Time |
Average hold time of all handled inbound calls |
Avg Wrap Time |
Average post-call-work wrap time of all handled inbound calls |
Avg Handling Time |
Average Handling Time (ring+talk+hold+post call) of all handled inbound calls |
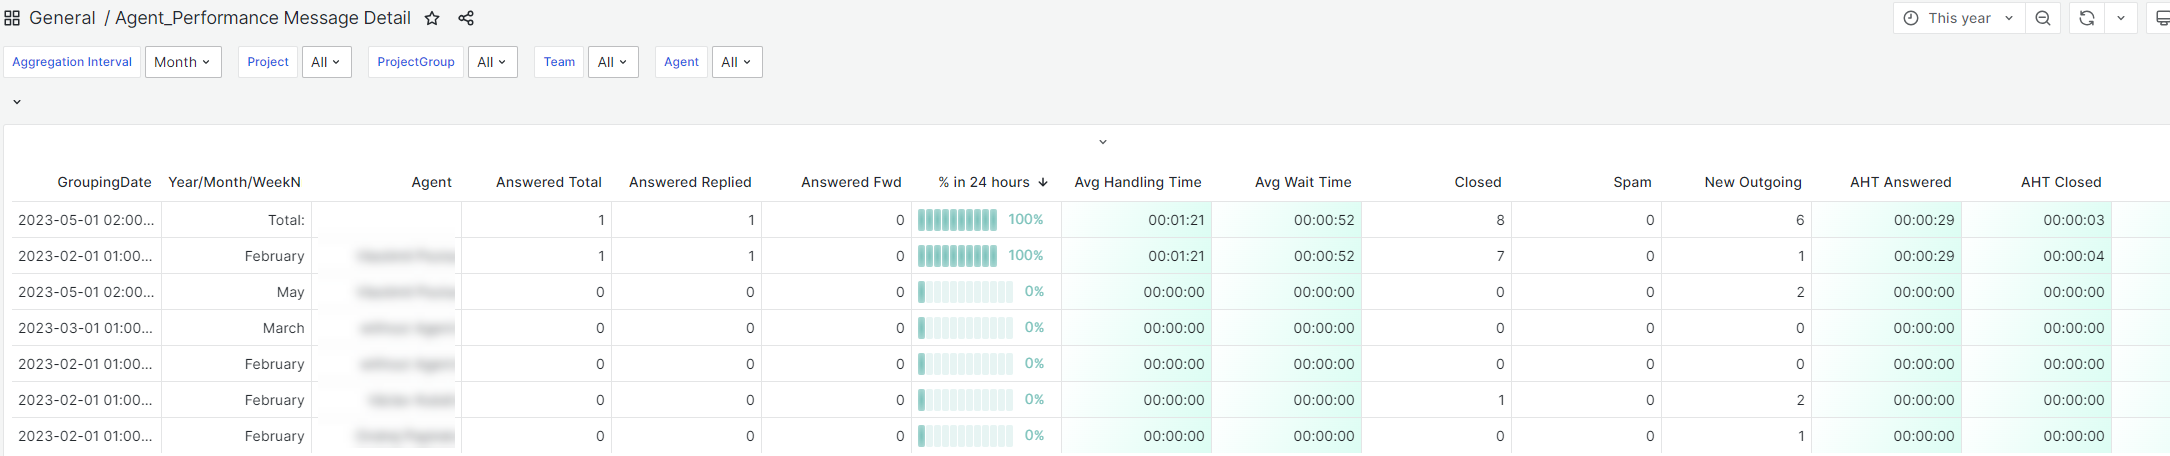
Message detail
Filters:
Aggregation Interval - divides the data into selected period, then presented in these periods per row
ProjectGroup, Project, Team, Agent - filters the displayed data according to inserted values
Available columns, all of them depend on the Aggregation Interval:
Column |
Explanation |
|---|---|
GroupingDate |
Day-Time/Month/ Year - depends on the parameter “Aggregation Interval” |
Year/Month/WeekN |
Day of Week name/Month name/Week number |
Answered Total |
All outgoing messages sent as an answer to incoming messages, including forwarded ones |
Answered Replied |
All outgoing messages sent as a reply to an incoming message |
Answered Fwd |
All outgoing forwarded messages |
% in 24 hours |
% of all messages answered within 24 hours |
Avg Handling Time |
The average message handling time – the average time that answered messages waited for a Reply (Reply Sent Time - Incoming Message Delivery Time) |
Avg Wait Time |
The average message waiting time – the average time that answered messages waited in a queue to be distributed and accepted for processing by an agent |
Closed |
All incoming messages that were closed without a reply |
Spam |
All incoming messages that were closed and marked as Spam |
New Outgoing |
All new outgoing messages |
AHT Answered |
Average Agent Handling Time of answered (and forwarded) messages (Reply Sent Time - Accepted Time) |
AHT Closed |
The average agent handling time of closed messages and closed without a reply messages (Closed Time - Accepted Time) |
AHT Spam |
The average agent handling time of messages marked as spam |
AHT New Outgoing |
The average agent handling time of new outgoing messages |
Answered SMS |
All SMS replies sent |
New Out SMS |
All new outbound SMS sent |
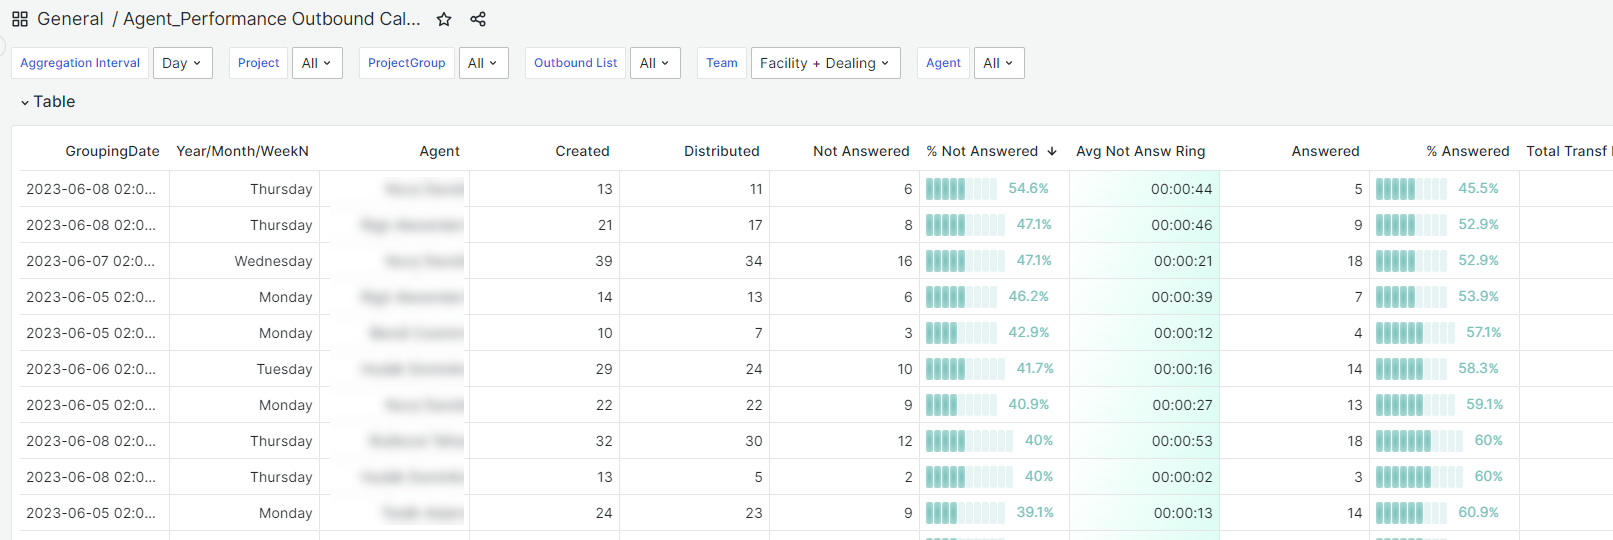
Outbound calls
Filters:
Aggregation Interval - divides the data into selected period, then presented in these periods per row
ProjectGroup, Project, Outboun List, Team, Agent - filters the displayed data according to inserted values
Available columns, all of them depend on the Aggregation Interval:
Column |
Explanation |
|---|---|
GroupingDate |
Day-Time/Month/ Year - depends on the parameter “Aggregation Interval” |
Year/Month/WeekN |
Day of Week name/Month name/Week number |
Created |
All Outgoing Calls that were created by agents or system |
Distributed |
All outgoing calls that were distributed to agents |
Not Answered |
All outgoing calls that were distributed to agents but were not successful (i.e. cancelled by agent, not connected, not answered etc.) |
% Not Answered |
% of all outgoing calls that were distributed to agents but were not successful (i.e. cancelled by agent, not connected, not answered by client etc.) |
Avg Not Answ Ring |
Average ringing time of all the not connected outgoing calls |
Answered |
All outgoing calls that were distributed to agents that were successful (i.e. answered by the client) |
% Answered |
% of all outgoing calls that were distributed to agents but were not successful (i.e. cancelled by agent, not connected, not answered by client etc.) |
Total Transf by Agents |
SUM of “Transf within CC by Agents” and “Transf out CC by Agents” |
% Transf by Agents |
% of all outgoing calls that were distributed to agents but were not successful (i.e. cancelled by agent, not connected, not answered by client etc.) |
Transf within CC by Agents |
All outbound calls that were handled by agents and then transferred within CC |
Transf out CC by Agents |
All outbound calls that were handled by agents and then transferred outside CC |
Avg Ring Time |
Average ringing time of all connected outgoing calls |
Avg Hold Time |
Average hold time of all connected outgoing calls |
Avg Talk Time |
Average talk time of all connected outgoing calls |
Avg Wrap Time |
Average post-call wrap time of all connected outgoing calls |
Avg Handling Time |
Average handling time (ring+talk+hold+post call) of all connected outgoing calls |
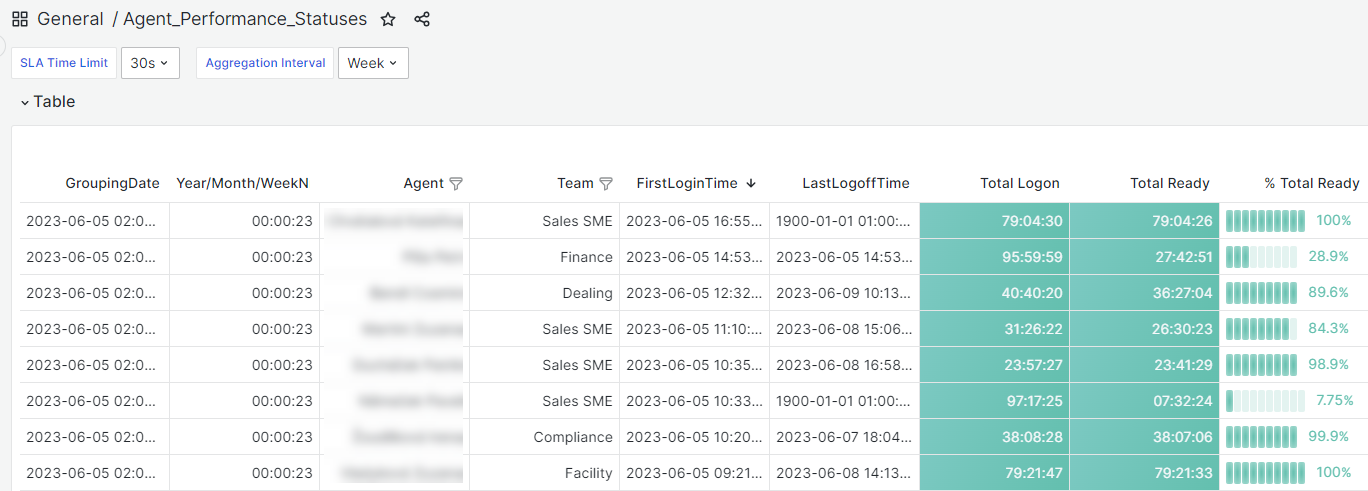
Statuses
Filters:
Aggregation Interval - divides the data into selected period, then presented in these periods per row
SLA Time Limit - Affects SLA calculations
Available columns, all of them depend on the Aggregation Interval:
Column |
Explanation |
|---|---|
GroupingDate |
Day-Time/Month/ Year - depends on the parameter “Aggregation Interval” |
Year/Month/WeekN |
Day of Week name/Month name/Week number |
FirstLoginTime |
Time when the agent logged into the CC for the first time |
LastLogoffTime |
Time when the agent logged out the CC for the last time |
Total Logon |
Total agent´s logon time |
Total Ready |
Total time, when agent was in a Ready state |
% Total Ready |
percentage of the Ready time from the Login duration |
Total Pause |
Total time, when agent was in a Pause state |
% Total Pause |
percentage of the Ready time from the Login duration |
Based on your installation, this report will also display all of your particular agent states at the end of the table. Each state will have its own column. They represent a total time, that agent did spend in the particular state.
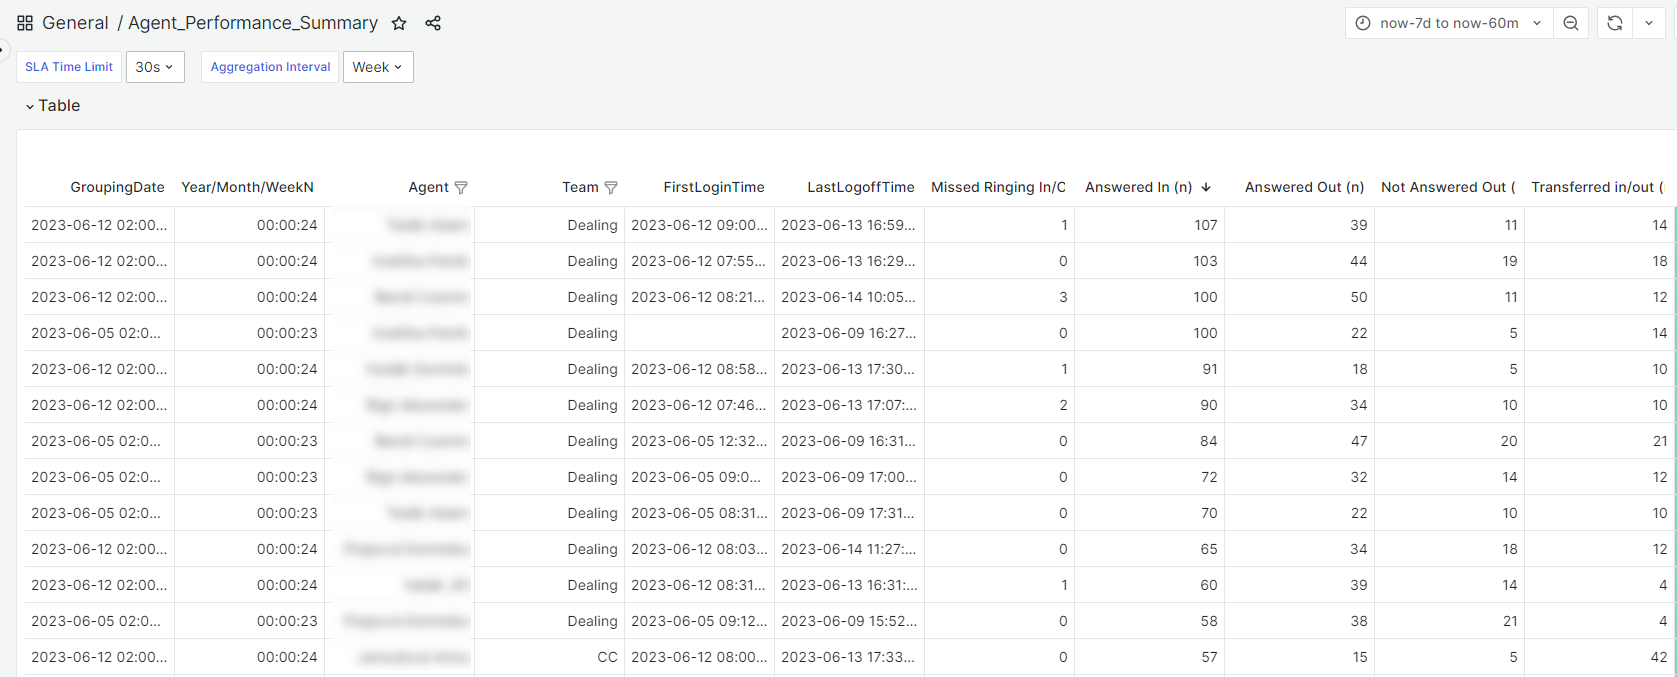
Summary
Filters:
Aggregation Interval - divides the data into selected period, then presented in these periods per row
SLA Time Limit - Affects SLA calculations
Available columns, all of them depend on the Aggregation Interval:
Column |
Explanation |
|---|---|
GroupingDate |
Day-Time/Month/ Year - depends on the parameter “Aggregation Interval” |
Year/Month/WeekN |
Day of Week name/Month name/Week number |
FirstLoginTime |
Time when the agent logged into the CC for the first time |
LastLogoffTime |
Time when the agent logged out the CC for the last time |
Missed Ringing In/C |
Number of calls when the agent failed to answer the inbound/outbound call offer |
Answered In (n) |
Number of handled inbound calls by the agent |
Answered Out (n) |
Number of handled outbound calls by the agent |
Not Answered Out (n) |
Number of not-handled outbound calls by the agent |
Transferred In/Out |
Number of handled inbound calls that were transferred within CC/outside CC by the agent |
Total Logon |
Total agent´s logon time |
Busy In |
Total time, when agent was handling Inbound calls |
Busy Out |
Total time, when agent was handling Outbound calls |
Total Busy |
SUM of “Busy In” and “Busy Out” |
% Total Busy |
percentage of the Ready time from the Login duration |
Total Idle |
Total time, when agent was in an Idle state |
% Total Idle |
percentage of the Ready time from the Login duration |
Total Ready |
Total time, when agent was in a Ready state |
% Total Ready |
percentage of the Ready time from the Login duration |
Total Pause |
Total time, when agent was in a Pause state |
% Total Pause |
percentage of the Ready time from the Login duration |
Based on your installation, this report will also display all of your particular agent states at the end of the table. Each state will have its own column. They represent a total time, that agent did spend in the particular state.
Contact Centre Performance reports
Set of reports, that aim on a contact centre as a whole.
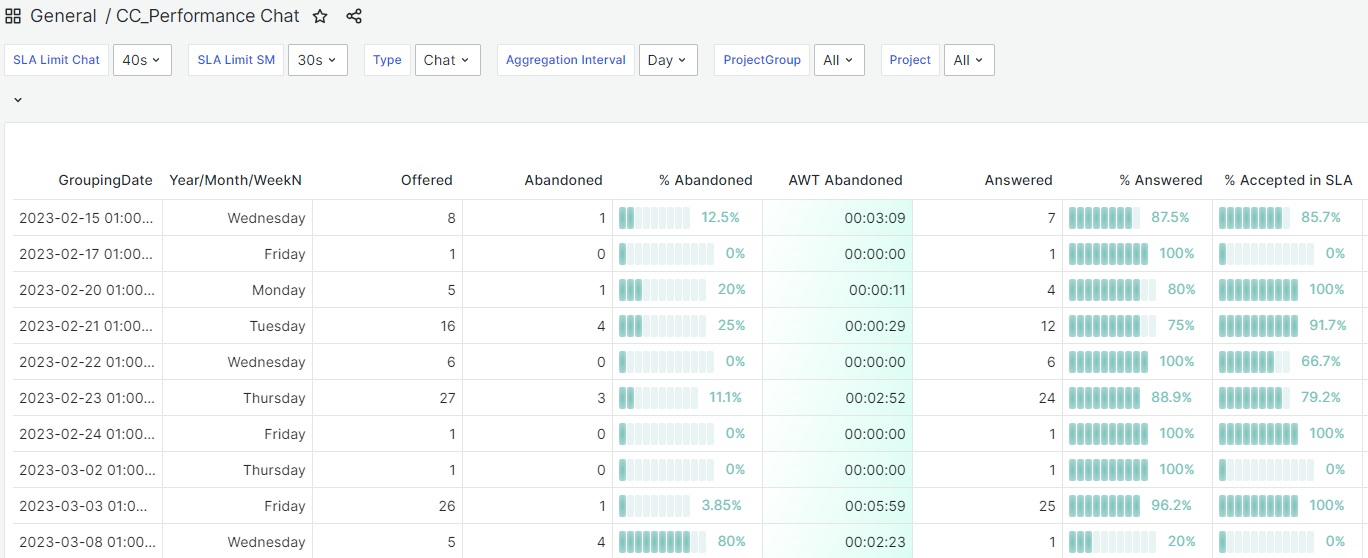
Chat
Filters:
SLA Limit Chat - Affects SLA calculations for Chat records
SLA Limit SM - Affects SLA calculations for Social IM records
Type - displays the data according to the communication type. Chat or Social IM
Aggregation Interval - divides the data into selected period, then presented in these periods per row
ProjectGroup and Project - filters the displayed data according to inserted values
Available columns, all of them depend on the Aggregation Interval:
Column |
Explanation |
|---|---|
GroupingDate |
Day-Time/Month/ Year - depends on the parameter “Aggregation Interval” |
Year/Month/WeekN |
Day of Week name/Month name/Week number |
Offered |
All incoming conversations |
Abandoned |
All incoming conversations that were Lost, no agent accepted the conversation |
% Abandoned |
percentage of all incoming Lost conversations |
AWT Abandoned |
Average time in ICR + Queue of all lost incoming conversations |
Answered |
All incoming conversations that were actually handled by agents |
% Answered |
% of all incoming conversations that were handled by agents |
% Accepted in SLA |
% of all incoming conversations that were accepted by agents in selected SLA time |
% First Reply in SLA |
% of all incoming conversations that were actually answered by agents in SLA time |
AWT for Accept |
The average time that conversations had been waiting until they were accepted by agents for processing |
AWT for First Reply |
The average time that clients had been waiting until they received the first reply from the agent |
AVG Alert Time |
The average alert time of all the handled conversations |
AVG Handling Time |
The average handling time of all the handled conversations |
AVG Client Replies |
The average number of messages sent by a client per handled conversation |
AVG Client Reply Length |
The average number of characters in a message, sent by a client per handled conversation |
AVG Agent Replies |
The average number of messages sent by an agent per handled conversation |
AVG Agent Reply Length |
The average number of characters in a message, sent by an agent per handled conversation |
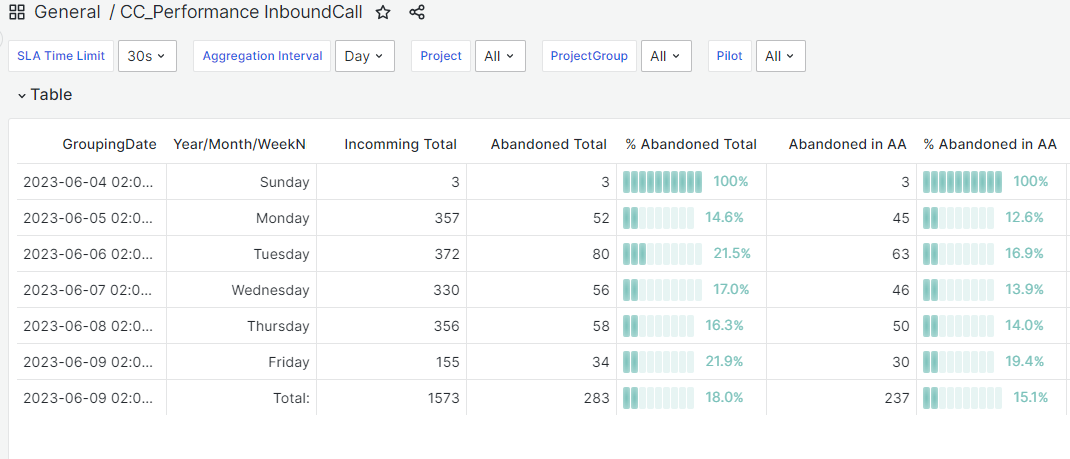
Inbound calls
Filters:
SLA Time Limit - Affects SLA calculations
Aggregation Interval - divides the data into selected period, then presented in these periods per row
ProjectGroup, Project, Pilot - filters the displayed data according to inserted values
Available columns, all of them depend on the Aggregation Interval:
Column |
Explanation |
|---|---|
GroupingDate |
Day-Time/Month/ Year - depends on the parameter “Aggregation Interval” |
Year/Month/WeekN |
Day of Week name/Month name/Week number |
Incoming Total |
All inbound calls |
Abandoned Total |
Total inbound calls that were lost (in Pilot, IVR, Queue or in Distribution) |
% Abandoned Total |
percentage of metric above compared to Incoming Total |
Abandoned in AA |
All inbound calls that were lost in AA or Pilot |
% Abandoned in AA |
percentage of metric above compared to Incoming Total |
Abandoned after AA |
All inbound calls that were lost in a queue |
% Abandoned after AA |
percentage of metric above compared to Incoming Total |
Avg Ab. Queue Time |
Average time in AA + queue of all lost inbound calls |
Answered Total |
All handled inbound calls |
% Answered |
percentage of metric above compared to Incoming Total |
Answered in SLA limit |
All inbound calls that were handled by agents within SLA limit |
% SLA |
percentage of metric above compared to Incoming Total |
Transferred in AA |
All inbound calls that were transferred in AA |
% Transf by AA |
percentage of metric above compared to Incoming Total |
Total Transf by Agents |
All inbound calls that were handled and then transferred within CC or outside CC (SUM of both) |
% Transf by Agents |
% of the calculation above from all of the inbound calls |
Transf within CC by Agent |
All inbound calls that were handled by agents and then transferred within CC |
Transf out CC by Agents |
All inbound calls that were handled by agents and then transferred outside CC |
Avg AA Time |
Average time spent in AA of all handled inbound calls |
Avg Queue Time |
Average time spent in queue of all handled inbound calls |
Avg Ring Time |
Average ring time of all handled inbound calls |
Avg Talk Time |
Average talk time of all handled inbound calls |
Avg Hold Time |
Average hold time of all handled inbound calls |
Avg Wrap Time |
Average post-call-work wrap time of all handled inbound calls |
Avg Handling Time |
Average Handling Time (ring+talk+hold+post call) of all handled inbound calls |
Note
AA is a different term for the IVR.
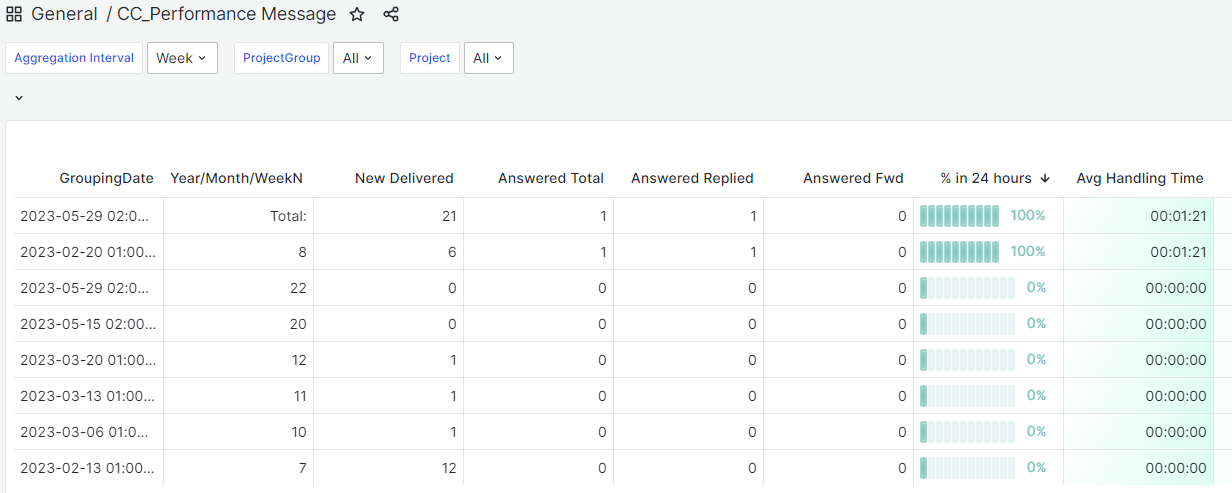
Message
Filters:
Aggregation Interval - divides the data into selected period, then presented in these periods per row
ProjectGroup, Project - filters the displayed data according to inserted values
Available columns, all of them depend on the Aggregation Interval:
Column |
Explanation |
|---|---|
GroupingDate |
Day-Time/Month/ Year - depends on the parameter “Aggregation Interval” |
Year/Month/WeekN |
Day of Week name/Month name/Week number |
New Delivered |
Messages delivered |
Answered Total |
All outgoing messages sent as an answer to incoming messages, including forwarded ones |
Answered Replied |
All outgoing messages sent as a reply to an incoming message |
Answered Fwd |
All outgoing forwarded messages |
% in 24 hours |
% of all messages answered within 24 hours |
Avg Handling Time |
The average message handling time – the average time that answered messages waited for a Reply (Reply Sent Time - Incoming Message Delivery Time) |
Avg Wait Time |
The average message waiting time – the average time that answered messages waited in a queue to be distributed and accepted for processing by an agent |
Closed |
All incoming messages that were closed without a reply |
Spam |
All incoming messages that were closed and marked as Spam |
New Outgoing |
All new outgoing messages |
AHT Answered |
Average Agent Handling Time of answered (and forwarded) messages (Reply Sent Time - Accepted Time) |
AHT Closed |
The average agent handling time of closed messages and closed without a reply messages (Closed Time - Accepted Time) |
AHT Spam |
The average agent handling time of messages marked as spam |
AHT New Outgoing |
The average agent handling time of new outgoing messages |
Answered SMS |
All SMS replies sent |
New Out SMS |
All new outbound SMS sent |
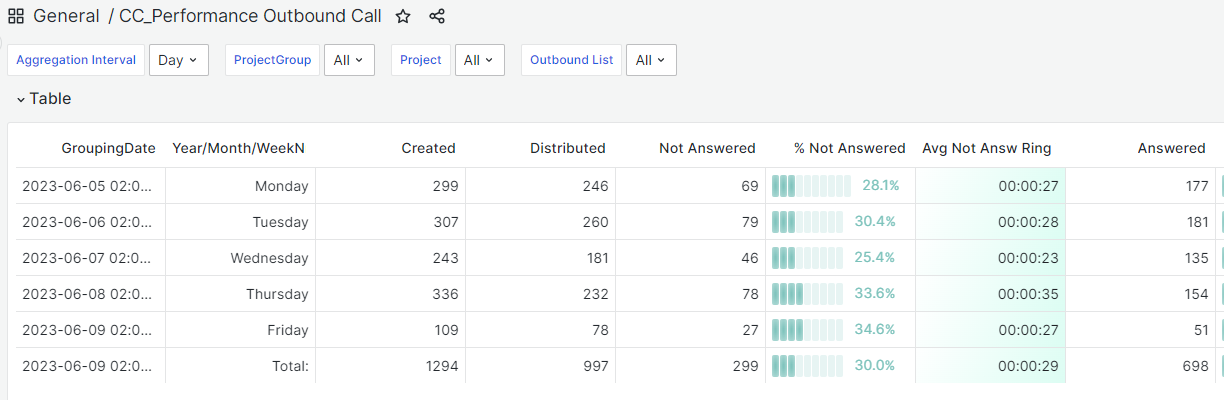
Outbound calls
Filters:
Aggregation Interval - divides the data into selected period, then presented in these periods per row
ProjectGroup, Project, Outboun List - filters the displayed data according to inserted values
Available columns, all of them depend on the Aggregation Interval:
Column |
Explanation |
|---|---|
GroupingDate |
Day-Time/Month/ Year - depends on the parameter “Aggregation Interval” |
Year/Month/WeekN |
Day of Week name/Month name/Week number |
Created |
All Outgoing Calls that were created by agents or system |
Distributed |
All outgoing calls that were distributed to agents |
Not Answered |
All outgoing calls that were distributed to agents but were not successful (i.e. cancelled by agent, not connected, not answered etc.) |
% Not Answered |
% of all outgoing calls that were distributed to agents but were not successful (i.e. cancelled by agent, not connected, not answered by client etc.) |
Avg Not Answ Ring |
Average ringing time of all the not connected outgoing calls |
Answered |
All outgoing calls that were distributed to agents that were successful (i.e. answered by the client) |
% Answered |
% of all outgoing calls that were distributed to agents but were not successful (i.e. cancelled by agent, not connected, not answered by client etc.) |
Total Transf by Agents |
SUM of “Transf within CC by Agents” and “Transf out CC by Agents” |
% Transf by Agents |
% of all outgoing calls that were distributed to agents but were not successful (i.e. cancelled by agent, not connected, not answered by client etc.) |
Transf within CC by Agents |
All outbound calls that were handled by agents and then transferred within CC |
Transf out CC by Agents |
All outbound calls that were handled by agents and then transferred outside CC |
Avg Ring Time |
Average ringing time of all connected outgoing calls |
Avg Hold Time |
Average hold time of all connected outgoing calls |
Avg Talk Time |
Average talk time of all connected outgoing calls |
Avg Wrap Time |
Average post-call wrap time of all connected outgoing calls |
Avg Handling Time |
Average handling time (ring+talk+hold+post call) of all connected outgoing calls |
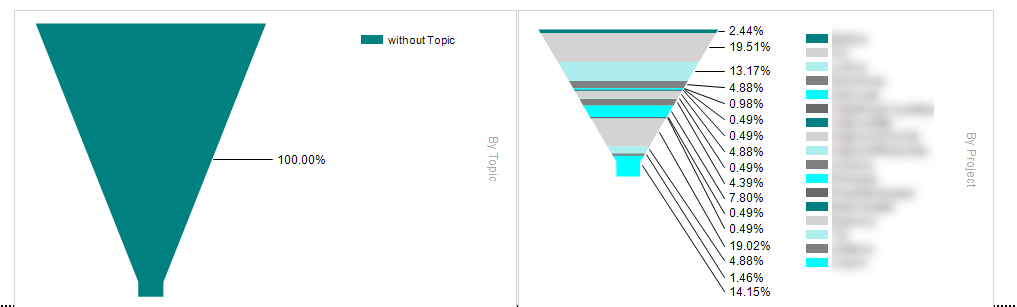
Issue
The purpose of this report is to provide information on how many interactions and what type of interactions are needed on average to handle an issue.
Filters:
Aggregation Interval - divides the data into selected period, then presented in these periods per row
ProjectGroup, Project, Topic, Subtopic - filters the displayed data according to inserted values
Available columns, all of them depend on the Aggregation Interval:
Column |
Explanation |
|---|---|
GroupingDate |
Day-Time/Month/Year - depends on the parameter “Aggregation Interval” |
Year/Month/WeekN |
Day of Week name/Month name/Week number |
Created Total |
All issues created by the agents or the system |
Closed Total |
Closed issue count |
InProgress Total |
Open issue count (status |
Reactivated |
Number of issues reactivated at one point in time at least once |
% Closed |
Percentage measurement of all the closed issues from all of the created ones. |
Avg Handling Time |
The average handling time of all the issues (time spent in states |
Avg Time in New |
Average issue time in the |
Avg Time in Open |
Average issue time in the |
Avg Time in Wait |
Average issue time in the |
Avg Time in Hold |
Average issue time in the |
Avg Interactions |
The average interaction count for all the issues according to the Aggregation Interval parameter. By interaction, we mean calls, emails, etc. |
Avg In Calls |
The average inbound call count for all the issues selected according to the Aggregation Interval parameter. |
Avg Out Calls |
The average outbound call count for all the issues selected according to the Aggregation Interval parameter. |
Avg Emails |
The average email count for all the issues selected according to the Aggregation Interval parameter. |
Avg Chats |
The average chat count(Social or Web) for all the issues selected according to the Aggregation Interval parameter. |
Avg Participating Agents |
The average number of agents involved (e.g. agent1 - making an interaction, agent2 - writing a note, etc.) for all issues according to Aggregation Interval |
Note
For more info about the statuses, see Phases and phase transitions.
SQL Server Reporting Services
“SQL Server Reporting Services” ( in the following referred to as SSRS) flexibly provides users with reports, which they can then run in a web browser on any device (or read via e-mail). For more information about SSRS, visit the official website .
Within FrontStage, this solution is delivered as standard in the case of local installation (on-premise) if Windows and MS SQL server technologies are used for it.
Repot usage
Each report has a set of filters that can be used to control it and set the desired output.

Below is a list of these filters, but each report contains only the filters relevant to its function.
Filters:
Language - Language of the text in the generated report.
Profile - The range of data to be evaluated by the report. You can choose predefined intervals or your own.
When “Today”, “Yesterday”, “This Week”, “This Month” and “Last Month” are selected, the evaluated range is displayed in From and To
When selecting “Free” you must enter your own range in From (for profile Free) and To (for profile Free)
From (for profile Free) - Date FROM for profile “Free”. If
NULLis checked, you must clear it to enter the value.To (for profile Free) - Date TO for profile “Free”. If
NULLis checked, you must clear it to enter the value.From - Explicitly displayed date FROM for predefined profiles
To - Explicitly displayed date TO for predefined profiles
Interval - Aggregation of data in the generated report. It affects the way you will evaluate the data. You can group data by hours, days, weeks, months, and years. The available intervals depend on the type of report.
Pilot - Filter on the pilot that passed the conversation to the contact center.
Workgroup - Agent group filter. Each agent can be in one group, set in its profile.
CrmMatch - A filter on records that have assigned a
ContactID, which means they are a known customerColumns - You can choose which columns to generate in the report.
Topic - If the conversation has an issue, filter the topic of the issue here.
Subtopic - If the conversation has an issue, filter the subtopic of the issue here.
Gateway - Filter the gateway that passed the conversation to the contact center.
Team - Agent team filter. Each agent can be in one team, set in his profile, item TeamName.
Project - Filtr on a “queue” assigned to the communication.
OutboundList - Outbound campaign filter, related to calls.
CallResultByAgent - Filter for call status, see. Outbound call statuses.
Channel - Filter for conversation type, such as message, chat, etc.
Type - For reports dealing with chat. Choice of “chat” or “social”.
Tip
If you change a filter value and the report disappears, use the  button to generate it again.
Agent Performance reports
Set of reports that aim on agents as individuals.
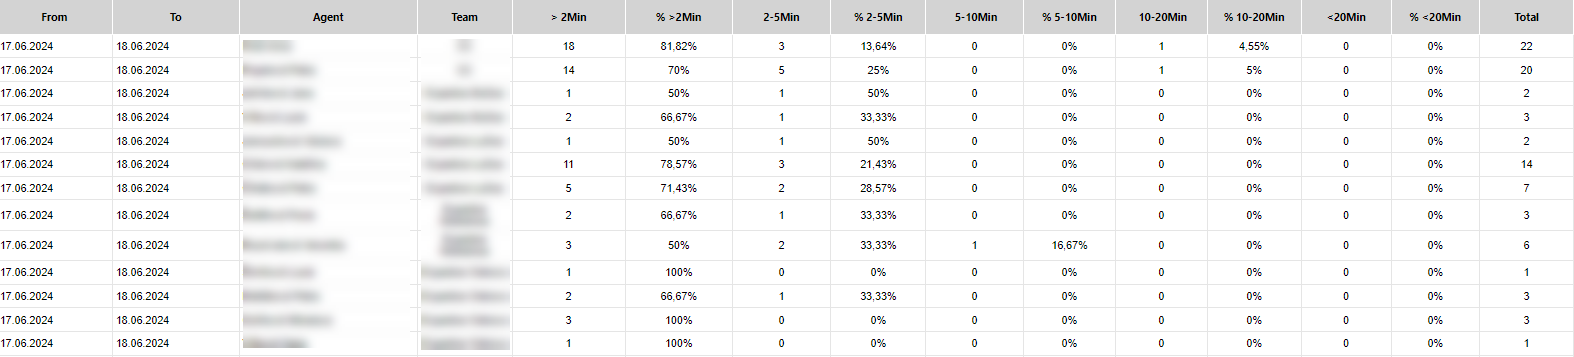
Inbound calls by duration
Note
Can be found in the list as Agent_Performance_ByInboundDuration
Compares the number of handled inbound calls by duration.
Chat (social media)
Note
Can be found in the list as Agent_Performance_Chat_SocialMedia
Divides handled chat and IM conversations by teams and agents.
All of the data in available columns depend on the Interval parameter:
Category |
Column |
Explanation |
|---|---|---|
Chat/Social Media |
Date |
Date related to the data on the row |
Chat/Social Media |
Weekday/Month/Year |
day of the week/month/year name - value depending on the Interval parameter |
Chat |
Offered |
All incoming chat conversations |
Chat |
Lost |
All inbound chat conversations that were lost, no agent accepted the conversation. |
Chat |
% Lost |
% of All inbound lost chat conversations/ All inbound chat conversations |
Chat |
AWT Lost |
Average time in ICR (Interactive chat response) + queue of all lost inbound conversations |
Chat |
Handled |
All incoming conversations that were actually handled by agents |
Chat |
% Handled |
% of all incoming chats that were handled by agents |
Chat |
% Accepted in 40s |
% of all incoming conversations that were accepted by agents in selected time limit |
Chat |
% First Reply in 40s |
% of all incoming conversations that were actually answered by agents in time limit |
Chat |
AWT for Accept |
The average time that conversations had been waiting until they were accepted by agents for processing |
Chat |
AWT for First Reply |
The average time that clients had been waiting until they received the first reply from the agent |
Chat |
AHT Client PoV |
Average processing time from the client’s perspective, i.e. from the beginning to the end of the chat conversation. |
Chat |
AVG Alert Time |
The average alert time of all the handled conversations |
Chat |
AHT Agent poV |
The average processing time for all chat conversations handled from the agent’s perspective, i.e. from receipt to completion of the conversation. |
Chat |
AVG Client Replies |
The average number of messages sent by a client per handled conversation |
Chat |
AVG Client Reply Length |
The average number of characters in a message, sent by a client per handled conversation |
Chat |
AVG Agent Replies |
The average number of messages sent by an agent per handled conversation |
Chat |
AVG Agent Reply Length |
The average number of characters in a message, sent by an agent per handled conversation |
Social media |
Offered |
All incoming IM conversations |
Social media |
Lost |
All incoming IM conversations that were Lost, no agent accepted the conversation |
Social media |
% Lost |
% of All incoming lost IM conversations / All incoming IM conversations |
Social media |
AWT Lost |
Average time in ICR (Interactive Chat Response) + queue of all lost incoming IM conversations |
Social media |
Handled |
All incoming IM conversations that were actually handled by agents |
Social media |
% Handled |
% of all incoming IM conversations that were handled by agents |
Social media |
% Accepted in 40s |
% of all incoming IM conversations that were accepted by agents in selected time limit |
Social media |
% First Reply in 40s |
% of all incoming IM conversations that were actually answered by agents in time limit |
Social media |
AWT for Accept |
The average time that conversations had been waiting until they were accepted by agents for processing |
Social media |
AWT for First Reply |
The average time that clients had been waiting until they received the first reply from the agent |
Social media |
AHT Client PoV |
Average processing time from the client’s perspective, i.e. from the beginning to the end of the IM conversation |
Social media |
AVG Alert Time |
The average alert time of all the handled conversations |
Social media |
AHT Agent poV |
Average processing time for all IM conversations handled from the agent’s perspective, i.e. from receipt to completion of the conversation. |
Social media |
AVG Client Replies |
The average number of messages sent by a client per handled conversation |
Social media |
AVG Client Reply Length |
The average number of characters in a message, sent by a client per handled conversation |
Social media |
AVG Agent Replies |
The average number of messages sent by an agent per handled conversation |
Social media |
AVG Agent Reply Length |
The average number of characters in a message, sent by an agent per handled conversation |
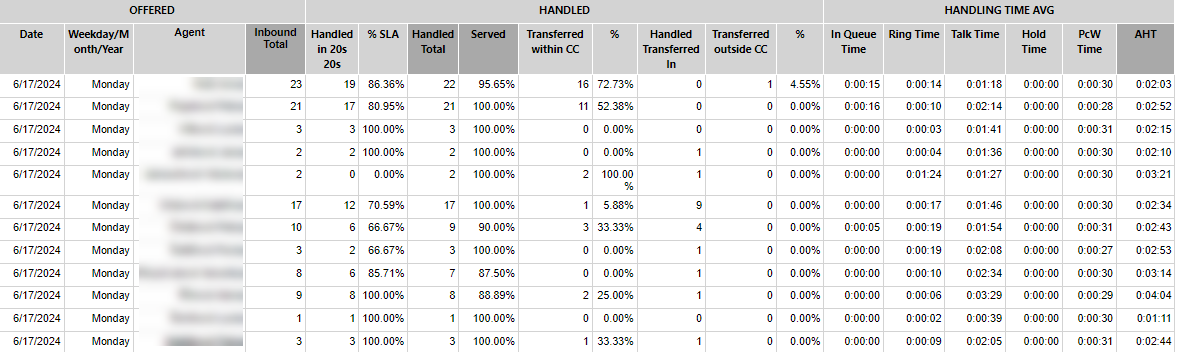
Inbound Calls - processing
Note
Can be found in the list as Agent_Performance_Inbound
Divides handled inbound calls by teams and agents.
All of the data in available columns depend on the Interval parameter:
Column |
Explanation |
|---|---|
Date |
Date related to the data on the row |
Weekday/Month/Year |
day of the week/month/year name - value depending on the Interval parameter |
Inbound Total |
All inbound calls |
Lost in IVR |
All inbound calls that were lost in IVR or Pilot |
% Lost in IVR |
percentage of metric above compared to Incoming Total |
Lost in Queue |
All inbound calls that were lost in a queue |
% Lost in Queue |
percentage of metric above compared to Incoming Total |
Lost IN |
All the inbound calls that have been “lost”. No agent picked them up from Pilot, IVR, hold, or distribution queue. |
Abandoned Rate |
percentage of metric above compared to Incoming Total |
AVG in IVR & QA Time |
Average time in IVR + queue of all lost inbound calls |
Handled in 20s |
All inbound calls that were handled by agents within time limit |
% SLA |
percentage of metric above compared to Incoming Total |
Handled Total |
All handled inbound calls |
% Served |
percentage of metric above compared to Incoming Total |
Transf within CC |
All inbound calls that were handled by agents and then transferred within CC |
Transf outside CC |
All inbound calls that were handled by agents and then transferred outside CC |
In IVR Time |
Average time spent in IVR of all handled inbound calls |
In Queue Time |
Average time spent in queue of all handled inbound calls |
Ring Time |
Average ring time of all handled inbound calls |
Talk Time |
Average talk time of all handled inbound calls |
Hold Time |
Average hold time of all handled inbound calls |
PcW Time |
Average metadata filling time (“Post call wrap”) of all answered inbound calls |
AHT (Average Handling Time) |
Average Handling Time (ring+talk+hold+post call) of all handled inbound calls |
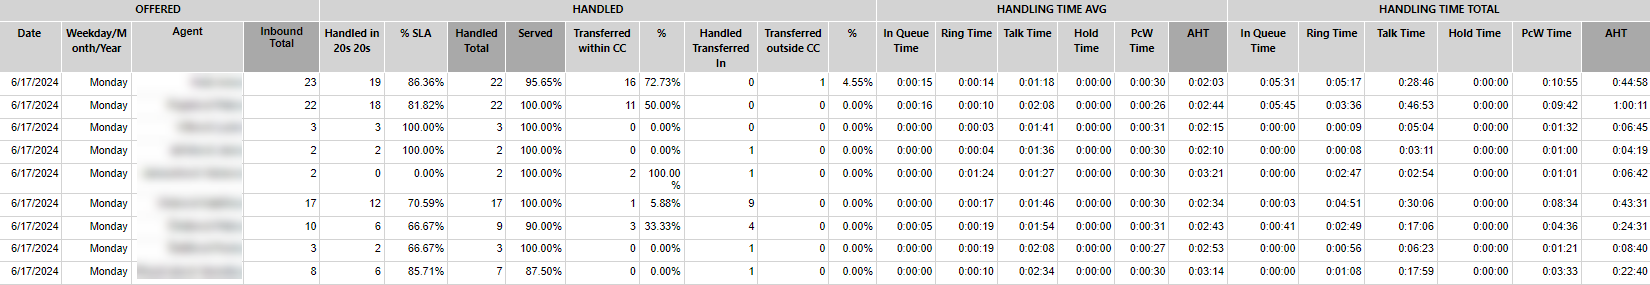
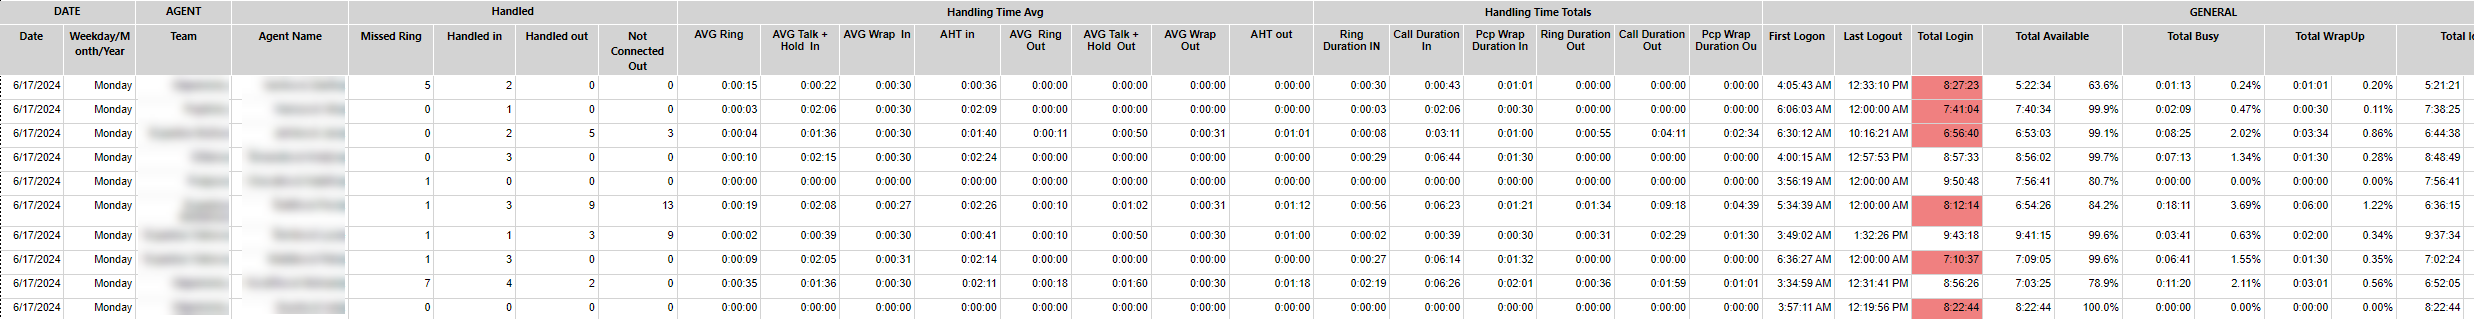
Inbound calls - processing in detail
Note
Can be found in the list as Agent_Performance_Inbound_extended
Divides handled inbound calls by teams and agents.
All of the data in available columns depend on the Interval parameter:
Column |
Explanation |
|---|---|
Date |
Date related to the data on the row |
Weekday/Month/Year |
day of the week/month/year name - value depending on the Interval parameter |
Inbound Total |
All inbound calls |
Lost in IVR |
All inbound calls that were lost in IVR or Pilot |
% Lost in IVR |
percentage of metric above compared to Incoming Total |
Lost in Queue |
All inbound calls that were lost in a queue |
% Lost in Queue |
percentage of metric above compared to Incoming Total |
Lost IN |
All the inbound calls that have been “lost”. No agent picked them up from Pilot, IVR, hold, or distribution queue. |
Abandoned Rate |
percentage of metric above compared to Incoming Total |
AVG in IVR & QA Time |
Average time in IVR + queue of all lost inbound calls |
Handled in 20s |
All inbound calls that were handled by agents within time limit |
% SLA |
percentage of metric above compared to Incoming Total |
Handled Total |
All handled inbound calls |
% Served |
percentage of metric above compared to Incoming Total |
Transf within CC |
All inbound calls that were handled by agents and then transferred within CC |
Transf outside CC |
All inbound calls that were handled by agents and then transferred outside CC |
In IVR Time |
Average time spent in IVR of all handled inbound calls |
In Queue Time |
Average time spent in queue of all handled inbound calls |
Ring Time |
Average ring time of all handled inbound calls |
Talk Time |
Average talk time of all handled inbound calls |
Hold Time |
Average hold time of all handled inbound calls |
PcW Time |
Average metadata filling time (“Post call wrap”) of all answered inbound calls |
AHT (Average Handling Time) |
Average Handling Time (ring+talk+hold+post call) of all handled inbound calls |
In IVR Time |
Total time of handled inbound calls in IVR |
In Queue Time |
Total time of handled inbound calls in Queue |
Ring Time |
Total ringing time of all handled inbound calls |
Talk Time |
Total talk time of all handled inbound calls |
Hold Time |
Total hold time of all handled inbound calls |
PcW Time |
Total PcW (metadata) time of all handled inbound calls |
AHT (Average Handling Time) |
Total processing time (ring + call + hold + metadata) of all handled inbound calls |
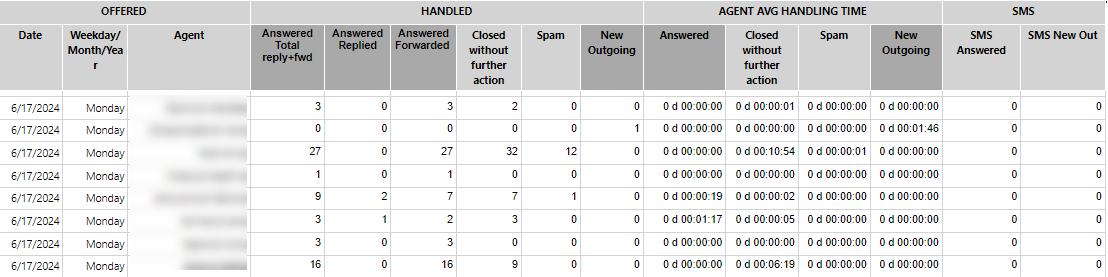
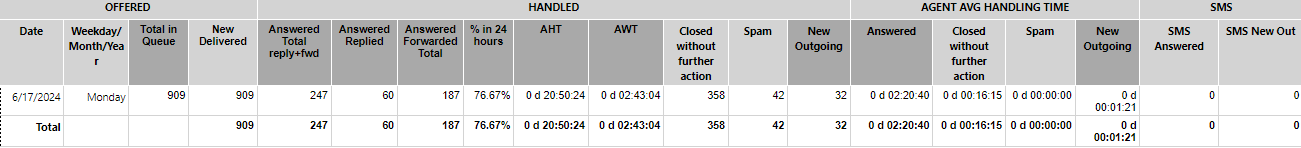
Messages
Note
Can be found in the list as Agent_Performance_Message
Divides handled emails and SMS by teams and agents.
All of the data in available columns depend on the Interval parameter:
Column |
Explanation |
|---|---|
Date |
Date related to the data on the row |
Weekday/Month/Year |
day of the week/month/year name - value depending on the Interval parameter |
Total in Queue |
Total number of emails in the queue on a given day - newly delivered emails on a given day + all other emails from the previous period that have not yet been answered (i.e. either not yet assigned and waiting in the queue, or already processed but not yet completed by the agent). |
New Delivered |
Emails delivered in the specified interval |
% New Delivered |
Percentage of the calculation above against “Total in Queue” |
In Queue |
All other emails from the previous interval that have not yet been answered (i.e. either they have not yet been assigned and are waiting in the queue, or they have already been processed but the agent has not yet completed them). |
% In Queue |
Percentage of the calculation above against “Total in Queue” |
Answered |
All outgoing messages sent as an answer to incoming messages, including forwarded ones |
% in 24 hours |
% of all messages answered within 24 hours |
AHT |
The average message handling time – the average time that answered messages waited for a Reply (Reply Sent Time - Incoming Message Delivery Time) |
AWT |
The average message waiting time – the average time that answered messages waited in a queue to be distributed and accepted for processing by an agent |
Closed |
All incoming messages that were closed without a reply |
Spam |
All incoming messages that were closed and marked as Spam |
New Outgoing |
All new outgoing messages |
AHT Answered |
Average Agent Handling Time of answered (and forwarded) messages (Reply Sent Time - Accepted Time) |
AHT Closed |
The average agent handling time of closed messages and closed without a reply messages (Closed Time - Accepted Time) |
AHT Spam |
The average agent handling time of messages marked as spam |
AHT Out |
The average agent handling time of new outgoing messages |
SMS Answered |
All SMS replies sent |
SMS New Out |
All new outbound SMS sent |
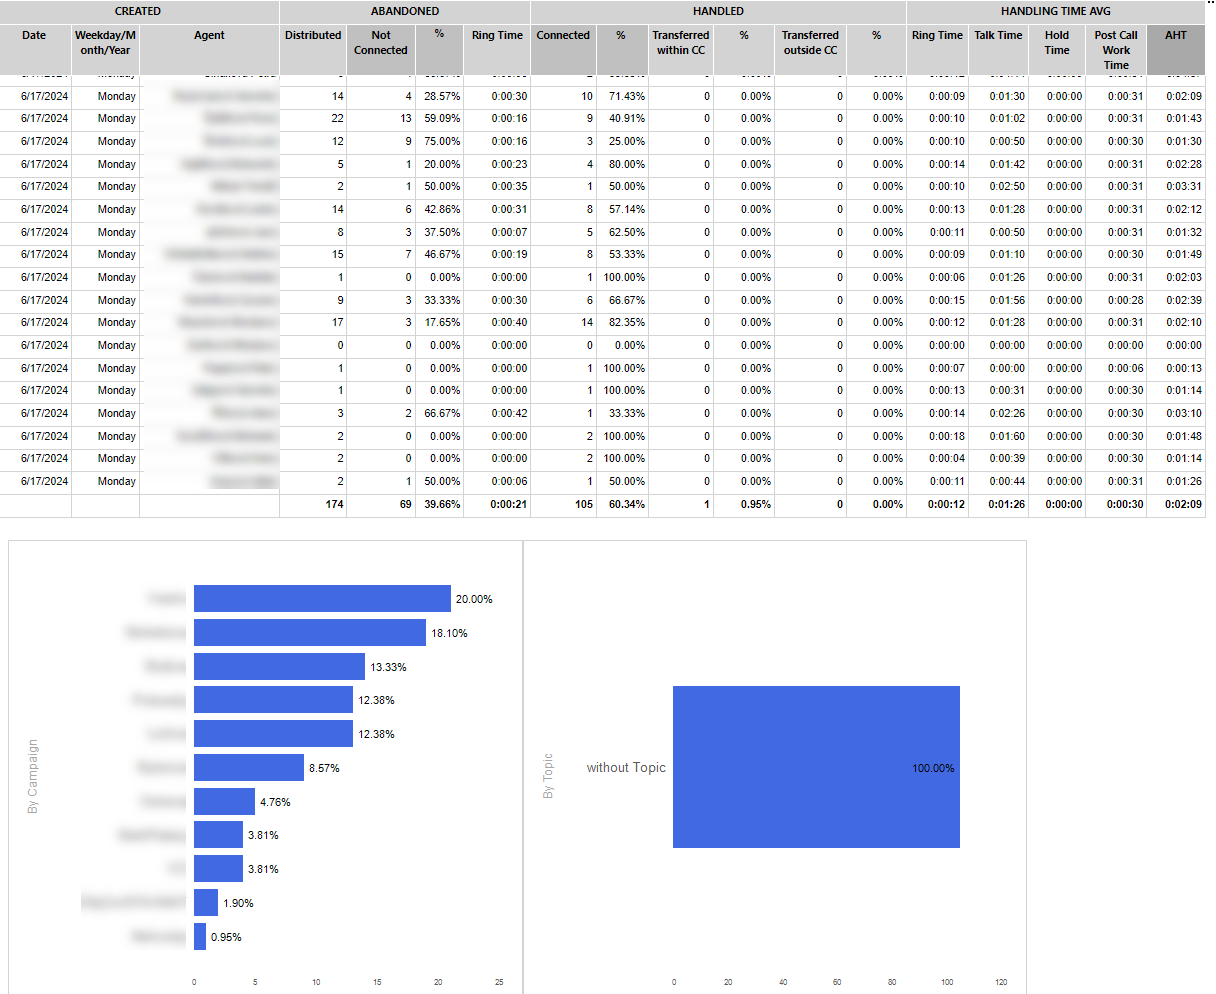
Outbound Calls
Note
Can be found in the list as Agent_Performance_Outbound
Distributes handled outbound calls by team and agent.
All of the data in available columns depend on the Interval parameter:
Column |
Explanation |
|---|---|
Date |
Date related to the data on the row |
Weekday/Month/Year |
day of the week/month/year name - value depending on the Interval parameter |
Created |
All Outgoing Calls that were created by agents or system |
Distributed |
All outgoing calls that were distributed to agents |
Not Connected |
All outgoing calls that were distributed to agents but were not successful (i.e. cancelled by agent, not connected, not answered etc.) |
% Not Connected |
% of all outgoing calls that were distributed to agents but were not successful (i.e. cancelled by agent, not connected, not answered by client etc.) |
Connected |
All outgoing calls that were distributed to agents that were successful (i.e. answered by the client) |
% Connected |
% of all outgoing calls that were distributed to agents but were not successful (i.e. cancelled by agent, not connected, not answered by client etc.) |
Transf within CC |
All outbound calls that were handled by agents and then transferred within CC |
Transf outside CC |
All outbound calls that were handled by agents and then transferred outside CC |
Ring Time |
Average ringing time of all connected outgoing calls |
Hold Time |
Average hold time of all connected outgoing calls |
Talk Time |
Average talk time of all connected outgoing calls |
PcP Wrap Time |
Average post-call wrap time of all connected outgoing calls |
AHT Time |
Average handling time (ring+talk+hold+post call) of all connected outgoing calls |
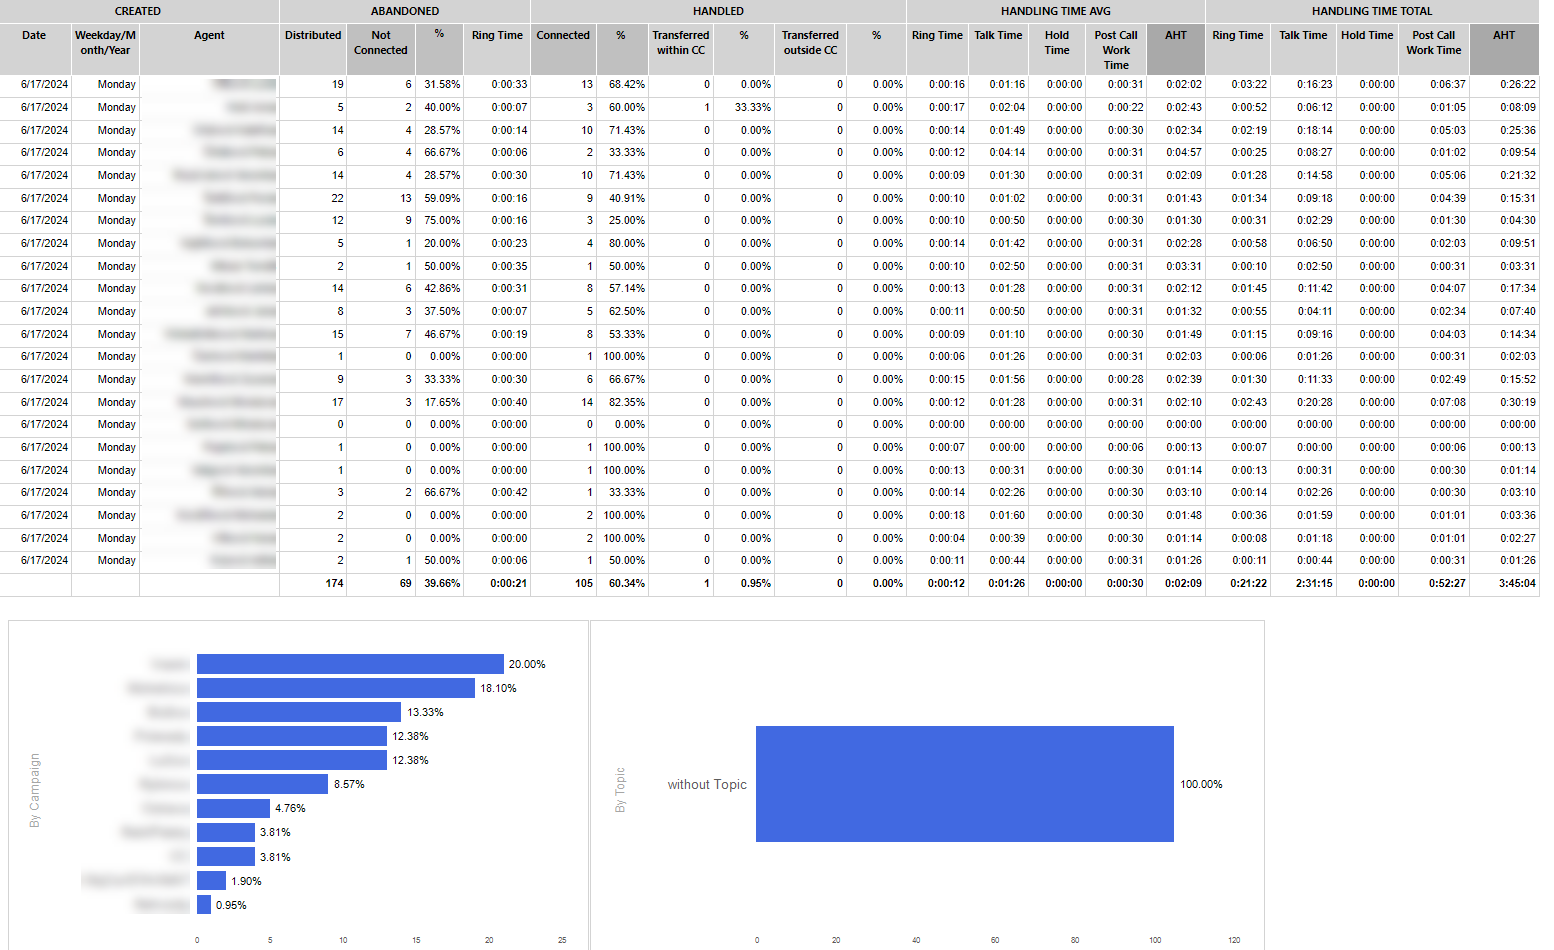
Outbound Calls - in detail
Note
Can be found in the list as Agent_Performance_Outbound_extended
All of the data in available columns depend on the Interval parameter:
Column |
Explanation |
|---|---|
Date |
Date related to the data on the row |
Weekday/Month/Year |
day of the week/month/year name - value depending on the Interval parameter |
Created |
All Outgoing Calls that were created by agents or system |
Distributed |
All outgoing calls that were distributed to agents |
Not Connected |
All outgoing calls that were distributed to agents but were not successful (i.e. cancelled by agent, not connected, not answered etc.) |
% Not Connected |
% of all outgoing calls that were distributed to agents but were not successful (i.e. cancelled by agent, not connected, not answered by client etc.) |
Connected |
All outgoing calls that were distributed to agents that were successful (i.e. answered by the client) |
% Connected |
% of all outgoing calls that were distributed to agents but were not successful (i.e. cancelled by agent, not connected, not answered by client etc.) |
Transf within CC |
All outbound calls that were handled by agents and then transferred within CC |
Transf outside CC |
All outbound calls that were handled by agents and then transferred outside CC |
Ring Time |
Average ringing time of all connected outgoing calls |
Hold Time |
Average hold time of all connected outgoing calls |
Talk Time |
Average talk time of all connected outgoing calls |
PcP Wrap Time |
Average post-call wrap time of all connected outgoing calls |
AHT Time |
Average handling time (ring+talk+hold+post call) of all connected outgoing calls |
Ring Time |
Total ringing time of all connected outgoing calls |
Hold Time |
Total hold time of all connected outgoing calls |
Talk Time |
Total talk time of all connected outgoing calls |
PcP Wrap Time |
Total post-call wrap(metadata) time of all connected outgoing calls |
AHT Time |
Total handling time (ring + talk + hold + post call) of all handled outgoing calls |
Agent login status
Note
Can be found in the list as Agent_Performance_Statuses
Provides information related to the activity of the agent(s), such as the amount of time the agent spends in different states, total login time, first login time, etc.
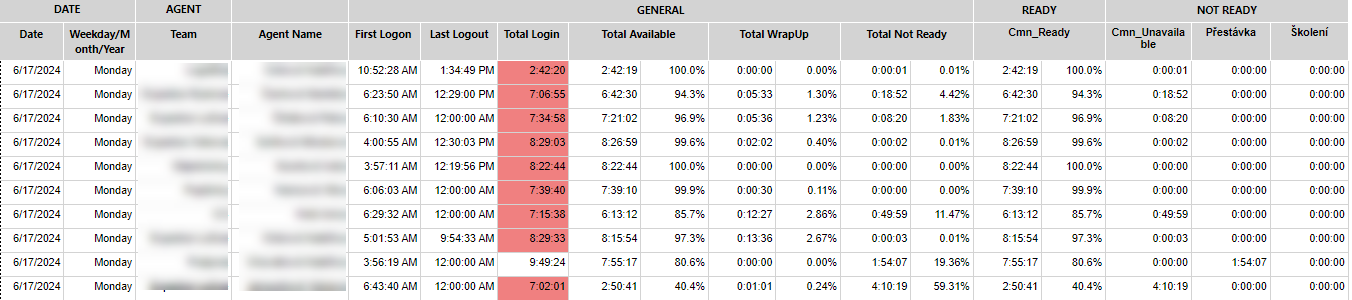
Agent performance - summary
Note
Can be found in the list as Agent_Performance_Summary
Provides an overview of agent activity and performance by displaying key information from the in-depth reports listed above.
All of the data in available columns depend on the Interval parameter:
Column |
Explanation |
|---|---|
Date |
Date related to the data on the row |
Weekday/Month/Year |
day of the week/month/year name - value depending on the Interval parameter |
Team name |
Name of the team in which the agent is assigned |
Agent name |
The particular agent name |
Inbound calls |
Number of handled inbound calls |
Outbound calls |
Number of handled outbound calls by the agent |
Missed Rings |
Number of calls when the agent failed to answer the inbound/outbound call offer |
Transferred calls |
Number of handled inbound calls that were transferred within CC/outside CC by the agent |
Answered Emails |
Number of inbound emails answered by the agent |
New Outgoing Emails |
Number of new outbound emails sent by the agent |
Login Time |
Time when the agent logged into the CC for the first time |
Logout Time |
Time when the agent logged out the CC for the last time |
Total Logon |
Total agent´s logon time |
Total Ready |
Total time, when agent was in a Ready state |
Total Not Ready |
Total time, when agent was in an Idle state |
Ready Time Detail |
Total availability time divided into individual availability states, predefined in the administration |
Not Ready Time Detail |
Total idle time divided into individual idle states, predefined in the administration |
Contact Centre Performance reports
Set of reports, that aim on a contact centre as a whole.
Chat (social media)
Note
Can be found in the list as CC_Performance_Chat_SocialMedia
Interaction volumes in chat and IM conversations, details of lost/lost conversations, key performance values, the average duration of different conversation phases, and the average number of messages and characters per chat session.
All of the data in available columns depend on the Interval parameter:
Category |
Column |
Explanation |
|---|---|---|
Chat/Social Media |
Date |
Date related to the data on the row |
Chat/Social Media |
Weekday/Month/Year |
day of the week/month/year name - value depending on the Interval parameter |
Chat |
Offered |
All incoming chat conversations |
Chat |
Lost |
All inbound chat conversations that were lost, no agent accepted the conversation. |
Chat |
% Lost |
% of All inbound lost chat conversations/ All inbound chat conversations |
Chat |
AWT Lost |
Average time in ICR (Interactive chat response) + queue of all lost inbound conversations |
Chat |
Handled |
All incoming conversations that were actually handled by agents |
Chat |
% Handled |
% of all incoming chats that were handled by agents |
Chat |
% Accepted in 40s |
% of all incoming conversations that were accepted by agents in selected time limit |
Chat |
% First Reply in 40s |
% of all incoming conversations that were actually answered by agents in time limit |
Chat |
AWT for Accept |
The average time that conversations had been waiting until they were accepted by agents for processing |
Chat |
AWT for First Reply |
The average time that clients had been waiting until they received the first reply from the agent |
Chat |
AHT Client PoV |
Average processing time from the client’s perspective, i.e. from the beginning to the end of the chat conversation. |
Chat |
AVG Alert Time |
The average alert time of all the handled conversations |
Chat |
AHT Agent poV |
The average processing time for all chat conversations handled from the agent’s perspective, i.e. from receipt to completion of the conversation. |
Chat |
AVG Client Replies |
The average number of messages sent by a client per handled conversation |
Chat |
AVG Client Reply Length |
The average number of characters in a message, sent by a client per handled conversation |
Chat |
AVG Agent Replies |
The average number of messages sent by an agent per handled conversation |
Chat |
AVG Agent Reply Length |
The average number of characters in a message, sent by an agent per handled conversation |
Social media |
Offered |
All incoming IM conversations |
Social media |
Lost |
All incoming IM conversations that were Lost, no agent accepted the conversation |
Social media |
% Lost |
% of All incoming lost IM conversations / All incoming IM conversations |
Social media |
AWT Lost |
Average time in ICR (Interactive Chat Response) + queue of all lost incoming IM conversations |
Social media |
Handled |
All incoming IM conversations that were actually handled by agents |
Social media |
% Handled |
% of all incoming IM conversations that were handled by agents |
Social media |
% Accepted in 40s |
% of all incoming IM conversations that were accepted by agents in selected time limit |
Social media |
% First Reply in 40s |
% of all incoming IM conversations that were actually answered by agents in time limit |
Social media |
AWT for Accept |
The average time that conversations had been waiting until they were accepted by agents for processing |
Social media |
AWT for First Reply |
The average time that clients had been waiting until they received the first reply from the agent |
Social media |
AHT Client PoV |
Average processing time from the client’s perspective, i.e. from the beginning to the end of the IM conversation |
Social media |
AVG Alert Time |
The average alert time of all the handled conversations |
Social media |
AHT Agent poV |
Average processing time for all IM conversations handled from the agent’s perspective, i.e. from receipt to completion of the conversation. |
Social media |
AVG Client Replies |
The average number of messages sent by a client per handled conversation |
Social media |
AVG Client Reply Length |
The average number of characters in a message, sent by a client per handled conversation |
Social media |
AVG Agent Replies |
The average number of messages sent by an agent per handled conversation |
Social media |
AVG Agent Reply Length |
The average number of characters in a message, sent by an agent per handled conversation |
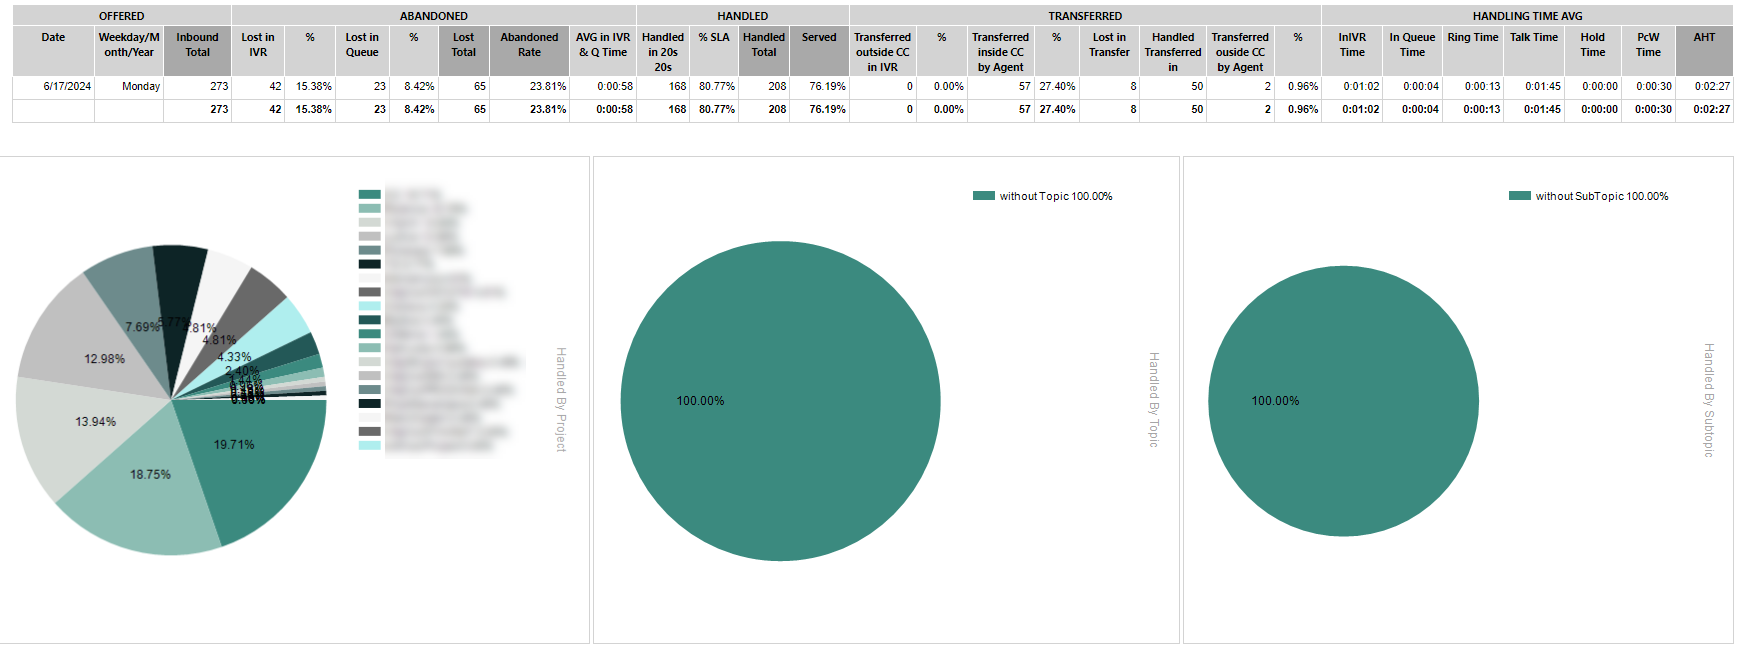
Inbound Calls
Note
Can be found in the list as CC_Performance_Inbound
Inbound call volumes, details of lost, transferred and handled inbound calls, key performance indicators.
All of the data in available columns depend on the Interval parameter:
Column |
Explanation |
|---|---|
Date |
Date related to the data on the row |
Weekday/Month/Year |
day of the week/month/year name - value depending on the Interval parameter |
Inbound Total |
All inbound calls |
Lost in IVR |
All inbound calls that were lost in IVR or Pilot |
% Lost in IVR |
percentage of metric above compared to Incoming Total |
Lost in Queue |
All inbound calls that were lost in a queue |
% Lost in Queue |
percentage of metric above compared to Incoming Total |
Lost IN |
All the inbound calls that have been “lost”. No agent picked them up from Pilot, IVR, hold, or distribution queue. |
Abandoned Rate |
percentage of metric above compared to Incoming Total |
AVG in IVR & QA Time |
Average time in IVR + queue of all lost inbound calls |
Handled in 20s |
All inbound calls that were handled by agents within time limit |
% SLA |
percentage of metric above compared to Incoming Total |
Handled Total |
All handled inbound calls |
% Served |
percentage of metric above compared to Incoming Total |
Transf within CC |
All inbound calls that were handled by agents and then transferred within CC |
Transf outside CC |
All inbound calls that were handled by agents and then transferred outside CC |
In IVR Time |
Average time spent in IVR of all handled inbound calls |
In Queue Time |
Average time spent in queue of all handled inbound calls |
Ring Time |
Average ring time of all handled inbound calls |
Talk Time |
Average talk time of all handled inbound calls |
Hold Time |
Average hold time of all handled inbound calls |
PcW Time |
Average metadata filling time (“Post call wrap”) of all answered inbound calls |
AHT (Average Handling Time) |
Average Handling Time (ring+talk+hold+post call) of all handled inbound calls |
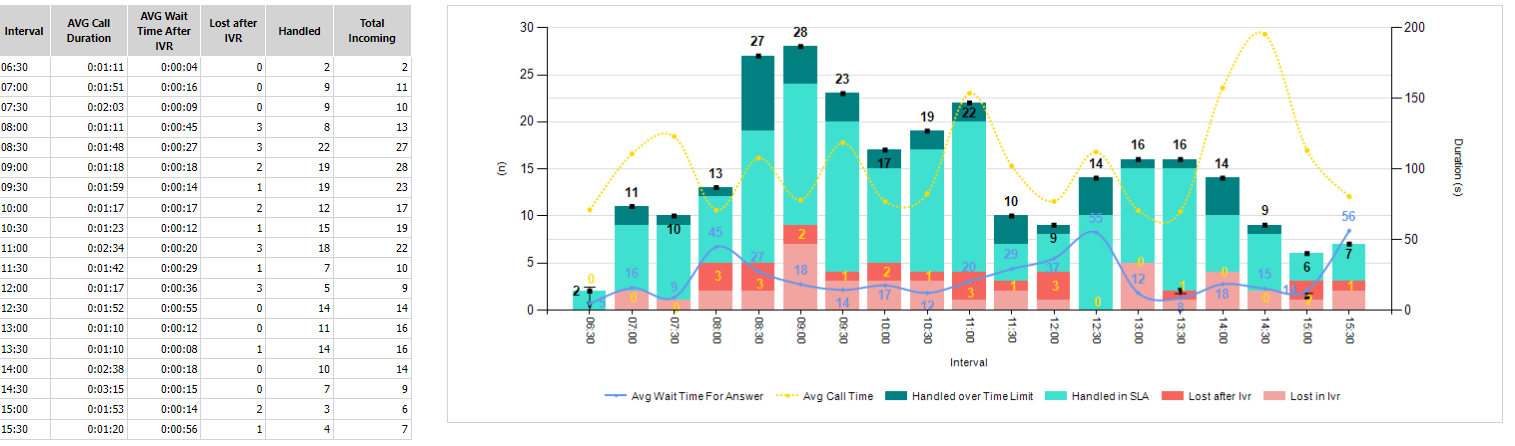
Inbound Calls balance
Note
Can be found in the list as CC_Performance_Inbound_Chart_cumulative
It displays the volume of inbound calls at different time periods ( an hour, 30 minutes, 15 minutes) to help predict staff needs throughout the day.
Inbound Calls in detail
Note
Can be found in the list as CC_Performance_Inbound_extended
An extended version of the inbound calls, it includes the average and total duration of the different phases of the call.
All of the data in available columns depend on the Interval parameter:
Column |
Explanation |
|---|---|
Date |
Date related to the data on the row |
Weekday/Month/Year |
day of the week/month/year name - value depending on the Interval parameter |
Inbound Total |
All inbound calls |
Lost in IVR |
All inbound calls that were lost in IVR or Pilot |
% Lost in IVR |
percentage of metric above compared to Incoming Total |
Lost in Queue |
All inbound calls that were lost in a queue |
% Lost in Queue |
percentage of metric above compared to Incoming Total |
Lost IN |
All the inbound calls that have been “lost”. No agent picked them up from Pilot, IVR, hold, or distribution queue. |
Abandoned Rate |
percentage of metric above compared to Incoming Total |
AVG in IVR & QA Time |
Average time in IVR + queue of all lost inbound calls |
Handled in 20s |
All inbound calls that were handled by agents within time limit |
% SLA |
percentage of metric above compared to Incoming Total |
Handled Total |
All handled inbound calls |
% Served |
percentage of metric above compared to Incoming Total |
Transf within CC |
All inbound calls that were handled by agents and then transferred within CC |
Transf outside CC |
All inbound calls that were handled by agents and then transferred outside CC |
In IVR Time |
Average time spent in IVR of all handled inbound calls |
In Queue Time |
Average time spent in queue of all handled inbound calls |
Ring Time |
Average ring time of all handled inbound calls |
Talk Time |
Average talk time of all handled inbound calls |
Hold Time |
Average hold time of all handled inbound calls |
PcW Time |
Average metadata filling time (“Post call wrap”) of all answered inbound calls |
AHT (Average Handling Time) |
Average Handling Time (ring+talk+hold+post call) of all handled inbound calls |
In IVR Time |
Total time of handled inbound calls in IVR |
In Queue Time |
Total time of handled inbound calls in Queue |
Ring Time |
Total ringing time of all handled inbound calls |
Talk Time |
Total talk time of all handled inbound calls |
Hold Time |
Total hold time of all handled inbound calls |
PcW Time |
Total PcW (metadata) time of all handled inbound calls |
AHT (Average Handling Time) |
Total processing time (ring + call + hold + metadata) of all handled inbound calls |

Issues
Note
Can be found in the list as CC_Performance_Issue
The purpose of this report is to provide information on how many interactions and what type of interactions are needed on average to handle an issue.
All of the data in available columns depend on the Interval parameter:
Column |
Explanation |
|---|---|
Date |
Date related to the data on the row |
Weekday/Month/Year |
day of the week/month/year name - value depending on the Interval parameter |
Created |
All issues created by the agents or the system |
Closed |
Number of all created issues that have been resolved |
In Progress |
Number of all created issues that have not yet been resolved (are in |
Reactivated |
Number of issues reactivated at one point in time at least once |
% Closed |
Percentage measurement of all the closed issues from all of the created ones. |
Avg Handling Time |
Average handling time of all processed issues(processing time in |
Avg Time in New |
Average issue time in the |
Avg Time in Open |
Average issue time in the |
Avg Time in Wait |
Average issue time in the |
Avg Time in Hold |
Average issue time in the |
Avg Interactions |
The average interaction count for all the issues according to the Interval parameter. By interaction, we mean calls, emails, etc. |
Avg In Calls |
The average inbound call count for all the issues |
Avg Out Calls |
The average outbound call count for all the issues |
Avg Emails |
The average email count for all the issues |
Avg Chats |
The average chat count(Social or Web) for all the issues |
Avg Participating Agents |
The average number of agents involved (e.g. agent1 - making an interaction, agent2 - writing a note, etc.) for all issues |
Note
For more info about the statuses, see Phases and phase transitions.
Messages
Note
Can be found in the list as CC_Performance_Message
Email interaction volume
All of the data in available columns depend on the Interval parameter:
Column |
Explanation |
|---|---|
Date |
Date related to the data on the row |
Weekday/Month/Year |
day of the week/month/year name - value depending on the Interval parameter |
Total in Queue |
Total number of emails in the queue on a given day - newly delivered emails on a given day + all other emails from the previous period that have not yet been answered (i.e. either not yet assigned and waiting in the queue, or already processed but not yet completed by the agent). |
New Delivered |
Emails delivered in the specified interval |
% New Delivered |
Percentage of the calculation above against “Total in Queue” |
In Queue |
All other emails from the previous interval that have not yet been answered (i.e. either they have not yet been assigned and are waiting in the queue, or they have already been processed but the agent has not yet completed them). |
% In Queue |
Percentage of the calculation above against “Total in Queue” |
Answered |
All outgoing messages sent as an answer to incoming messages, including forwarded ones |
% in 24 hours |
% of all messages answered within 24 hours |
AHT |
The average message handling time – the average time that answered messages waited for a Reply (Reply Sent Time - Incoming Message Delivery Time) |
AWT |
The average message waiting time – the average time that answered messages waited in a queue to be distributed and accepted for processing by an agent |
Closed |
All incoming messages that were closed without a reply |
Spam |
All incoming messages that were closed and marked as Spam |
New Outgoing |
All new outgoing messages |
AHT Answered |
Average Agent Handling Time of answered (and forwarded) messages (Reply Sent Time - Accepted Time) |
AHT Closed |
The average agent handling time of closed messages and closed without a reply messages (Closed Time - Accepted Time) |
AHT Spam |
The average agent handling time of messages marked as spam |
AHT Out |
The average agent handling time of new outgoing messages |
SMS Answered |
All SMS replies sent |
SMS New Out |
All new outbound SMS sent |
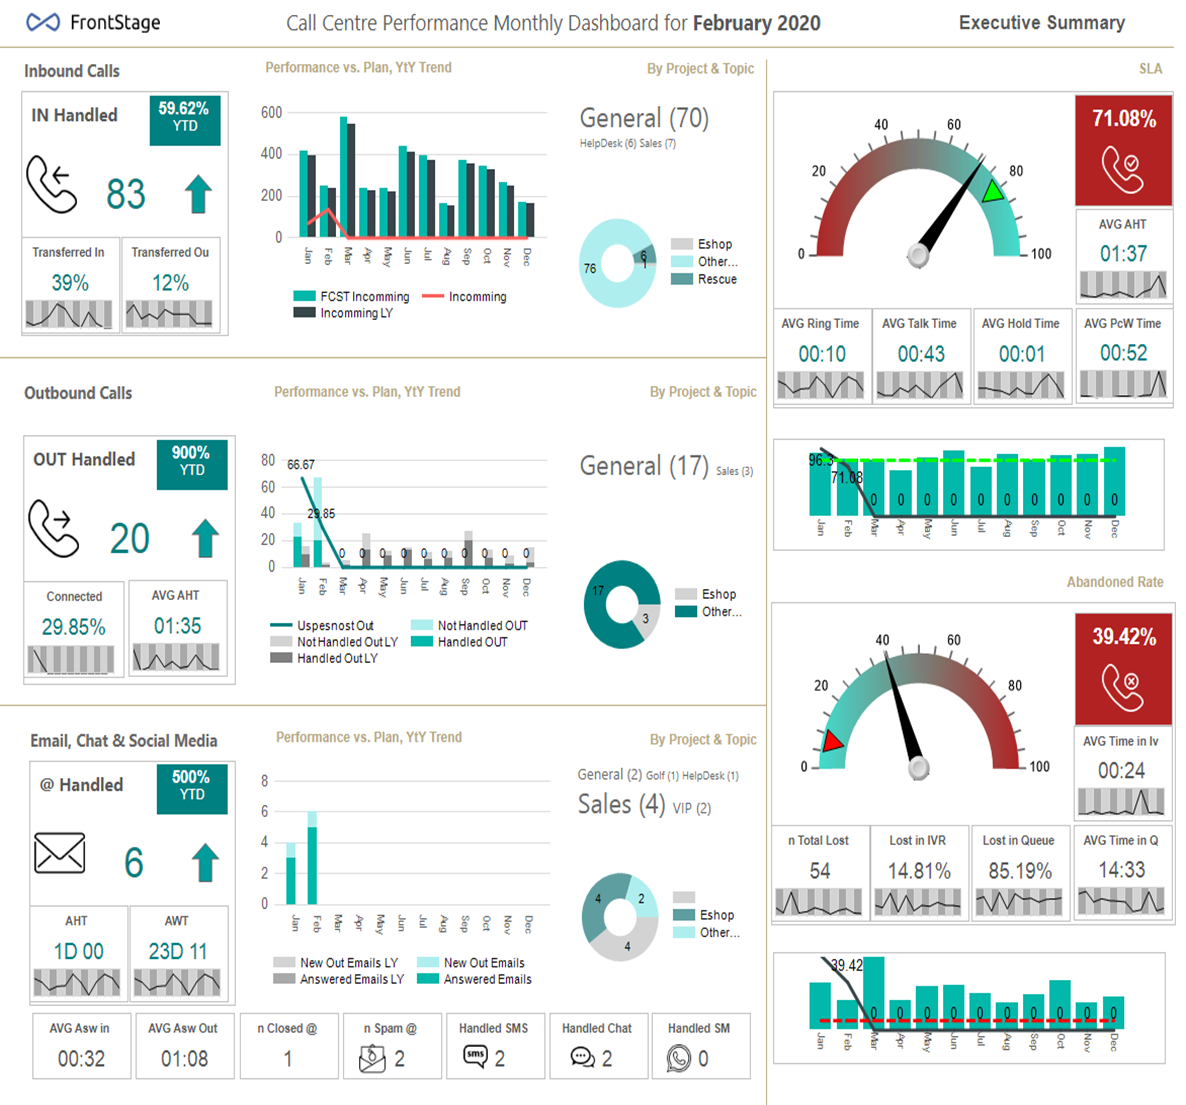
Monthly overview
Note
Can be found in the list as CC_Performance_Monthly_Dashboard
Summary of monthly operations and KPIs across channels: voice inbound and outbound, email, SMS, chat, and IM. Focus on year-on-year trends.
Column |
Explanation |
|---|---|
In Handled |
All inbound calls handled in the current month |
% YtD Change |
% of year-on-year evolution of the total number of calls handled |
Transferred In |
% of all the inbound calls handled in a given month that were transferred within the contact centre, below is the trend over the last year |
Transferred Out |
% of all inbound calls handled in a given month that were forwarded outside the contact centre, the trend for the last year is shown below |
Inbound call trend chart |
Year-on-year comparison of all inbound calls on a monthly basis (forecast, actual year, last year) |
Inbound Calls by Project and Topic |
All calls handled in the current month, broken down by call project and issue topic |
Out Handled |
All connected outbound calls made in the current month |
% YtD Change |
% of year-on-year evolution of the total number of connected outbound calls |
Connected |
% of all distributed outbound calls that were successfully connected to a client in a given month, the trend for the last year is shown below |
AVG AHT |
Average handling time of connected outbound calls in a given month, the trend for the last year is shown below |
Outbound Call Trend Chart |
A year-on-year comparison of all outbound calls connected/not connected (actual year, previous year) on a monthly basis |
Outbound Calls by Project and Topic |
All connected outbound calls in the current month, broken down by call project and issue topic. |
@ Handled |
All handled emails in the current month |
% YtD Change |
% of year-on-year evolution of the total number of handled e-mails |
AVG AHT |
Average handling time for all inbound emails responded to in a given month, below is the trend over the last year. |
AVG AWT |
The average wait time to be assigned an agent from all inbound emails responded to in a given month, below is the trend over the last year |
Email Trend Chart |
Year-on-year comparison of all answered and newly processed outbound emails (current year vs. last year) on a monthly basis |
Emails by Project and Topic |
All handled emails in the current month broken down by call project and issue topic |
SLA Gauge |
Indicator showing the achievement of the SLA target for inbound calls in a given month in % |
AVG AHT |
Average Handling Time (ring+talk+hold+post call) of all handled inbound calls in a given month |
AVG Ring Time |
Average ring time of all handled inbound calls in a given month |
AVG Talk Time |
Average talk time of all handled inbound calls in a given month |
AVG Hold Time |
Average waiting time for all handled inbound calls in a given month |
AVG Post Call Wrap Time |
Average post-call handling time for all inbound calls handled in a given month |
SLA Trend Chart |
SLA performance trend - last year’s performance vs. actual year, target indicator |
Abandoned Rate Gauge |
Indicator showing the rate of abandoned inbound calls while meeting the target in a given month in % |
n Total Lost |
Total number of lost inbound calls in a given month |
Lost in IVR |
% of all inbound calls in a given month that were lost in IVR or Pilot / All lost calls in a given month |
Lost in Queue |
% All inbound calls in a given month that were lost in queue / All lost calls in a given month |
AVG Time in IVR |
Average time in IVR of all lost inbound calls in a given month |
AVG Time in Queue |
Average queue time of all lost inbound calls in a given month |
Abandoned Rate Trend Chart |
Call abandonment rate trend - last year’s performance vs. actual year, target indicator |
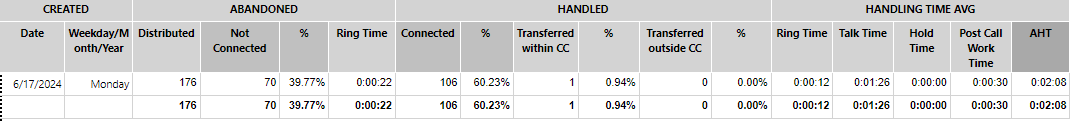
Outbound Calls
Note
Can be found in the list as CC_Performance_Outbound
Outbound call volume, detailing the success rate and average duration of the different call phases.
All of the data in available columns depend on the Interval parameter:
Column |
Explanation |
|---|---|
Date |
Date related to the data on the row |
Weekday/Month/Year |
day of the week/month/year name - value depending on the Interval parameter |
Created |
All Outgoing Calls that were created by agents or system |
Distributed |
All outgoing calls that were distributed to agents |
Not Connected |
All outgoing calls that were distributed to agents but were not successful (i.e. cancelled by agent, not connected, not answered etc.) |
% Not Connected |
% of all outgoing calls that were distributed to agents but were not successful (i.e. cancelled by agent, not connected, not answered by client etc.) |
Connected |
All outgoing calls that were distributed to agents that were successful (i.e. answered by the client) |
% Connected |
% of all outgoing calls that were distributed to agents but were not successful (i.e. cancelled by agent, not connected, not answered by client etc.) |
Transf within CC |
All outbound calls that were handled by agents and then transferred within CC |
Transf outside CC |
All outbound calls that were handled by agents and then transferred outside CC |
Ring Time |
Average ringing time of all connected outgoing calls |
Hold Time |
Average hold time of all connected outgoing calls |
Talk Time |
Average talk time of all connected outgoing calls |
PcP Wrap Time |
Average post-call wrap time of all connected outgoing calls |
AHT Time |
Average handling time (ring+talk+hold+post call) of all connected outgoing calls |
Outbound Calls - in detail
Note
Can be found in the list as CC_Performance_Outbound_extended
The extended version for outbound calls includes, the average and total duration of the different call phases.
All of the data in available columns depend on the Interval parameter:
Column |
Explanation |
|---|---|
Date |
Date related to the data on the row |
Weekday/Month/Year |
day of the week/month/year name - value depending on the Interval parameter |
Created |
All Outgoing Calls that were created by agents or system |
Distributed |
All outgoing calls that were distributed to agents |
Not Connected |
All outgoing calls that were distributed to agents but were not successful (i.e. cancelled by agent, not connected, not answered etc.) |
% Not Connected |
% of all outgoing calls that were distributed to agents but were not successful (i.e. cancelled by agent, not connected, not answered by client etc.) |
Connected |
All outgoing calls that were distributed to agents that were successful (i.e. answered by the client) |
% Connected |
% of all outgoing calls that were distributed to agents but were not successful (i.e. cancelled by agent, not connected, not answered by client etc.) |
Transf within CC |
All outbound calls that were handled by agents and then transferred within CC |
Transf outside CC |
All outbound calls that were handled by agents and then transferred outside CC |
Ring Time |
Average ringing time of all connected outgoing calls |
Hold Time |
Average hold time of all connected outgoing calls |
Talk Time |
Average talk time of all connected outgoing calls |
PcP Wrap Time |
Average post-call wrap time of all connected outgoing calls |
AHT Time |
Average handling time (ring+talk+hold+post call) of all connected outgoing calls |
Ring Time |
Total ringing time of all connected outgoing calls |
Hold Time |
Total hold time of all connected outgoing calls |
Talk Time |
Total talk time of all connected outgoing calls |
PcP Wrap Time |
Total post-call wrap(metadata) time of all connected outgoing calls |
AHT Time |
Total handling time (ring + talk + hold + post call) of all handled outgoing calls |

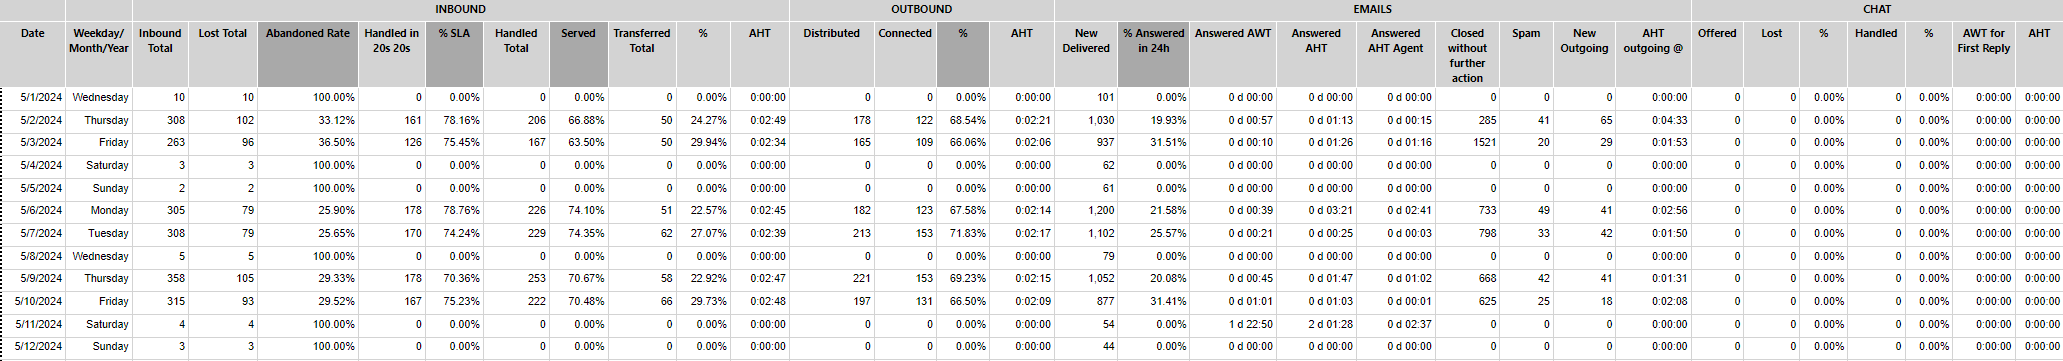
Summary of all the channels.
Note
Can be found in the list as CC_Performance_Summary_short
It provides an overview of the performance of the entire contact centre by displaying key information from the detailed reports above.
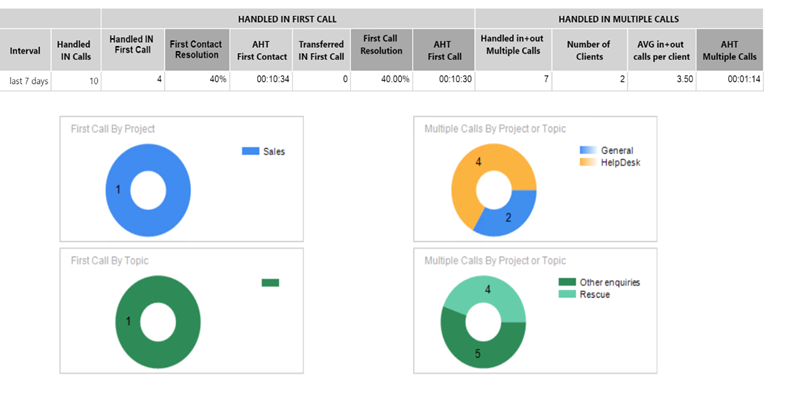
First call resolution
Note
Can be found in the list as CC_Performance_FirstCallResolution
Shows how many inbound customer inquiries (within the same project) were handled during the first call (i.e., no subsequent inbound or outbound inquiries).
The available columns and charts always refer to the selected Period parameter:
Column |
Explanation |
|---|---|
Interval |
last 24h/last 48h/last 7 days - according to the Period |
Handled IN Calls |
All handled inbound calls |
Handled IN First Call |
All completed inbound calls that were resolved in the first call by the client and a single agent (i.e., the call was not transferred to another agent or outside the contact center, nor was there another inbound call or outbound call from/to the same phone number within the same project). |
% First Contact Resolution |
% of inbound calls answered in the first call / All inbound calls answered |
AHT First Contact |
Average handling time (ring + call + hold + post-call time) of all calls handled on first contact with the client |
Handled IN First Call and Transferred |
All handled inbound calls that were handled in the customer’s first call, but were handled by more than 1 agent (i.e., transferred within the contact center) or transferred outside the contact center (no further inbound or outbound call from/to the same phone number within the same project). |
% First Call Resolution |
% Inbound calls answered in the first call with transfer / All answered inbound calls |
AHT First Call |
Average handling time (ring + call + hold + post-call time) of all calls handled in the first call with transfer |
Handled in+out Multiple Calls |
All calls handled if multiple inbound or outbound calls were made to/from the same phone number within the same project |
Number of Clients |
Number of clients whose inquiries were handled in multiple ( inbound + outbound) calls |
AVG Call per Client |
Average number of multiple calls answered ( inbound + outbound) per client |
AHT MUltiple Calls |
Average handling time (ring + call + hold + post-call time) of all calls handled in multiple inbound and outbound calls |