TeamsClient
As a supervisor, you have all the standard tabs and functions available for your work, just like an agent. For an introduction to the application, read about using the agent
Extra tabs are available for work specific to your function. These are only visible if your account has the Supervisor flag (configurable via Agents)
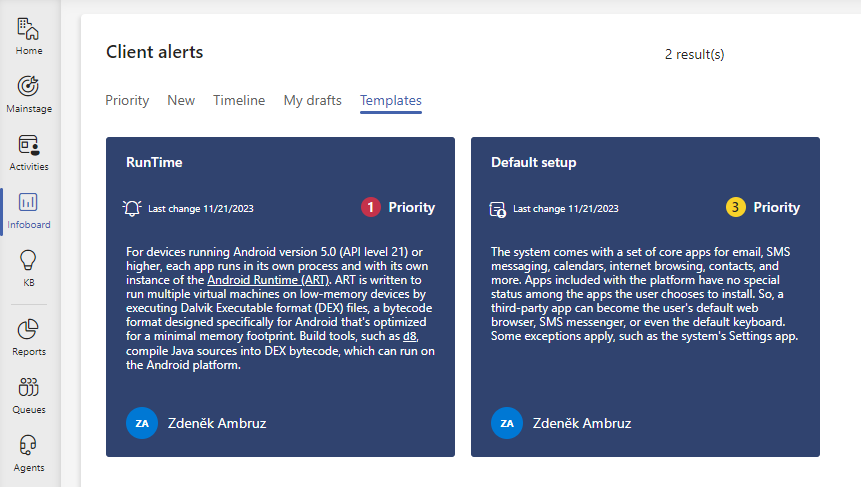
Infoboard
It serves as a bulletin-board, where the client alerts are displayed for the agents. You create the content, as users with higher permissions. The EditClientAlert role is required to do so.
Creating a Client alert
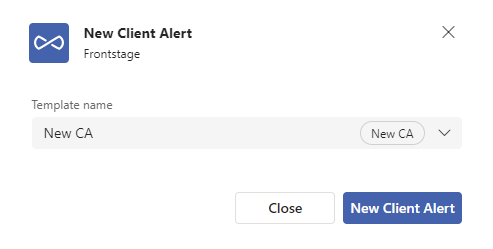
Open menu in application’s header and press New Client Alert
In a displayed pop-up window, you can select a template from a present drop-down menu, according to which the new client alert will be created. In other case, leave the selection empty and press New Client Alert
A Client Alert form will be displayed, opened on the Mainstage tab. Insert here its name and content, formating, numbering, links and other content options are supported.
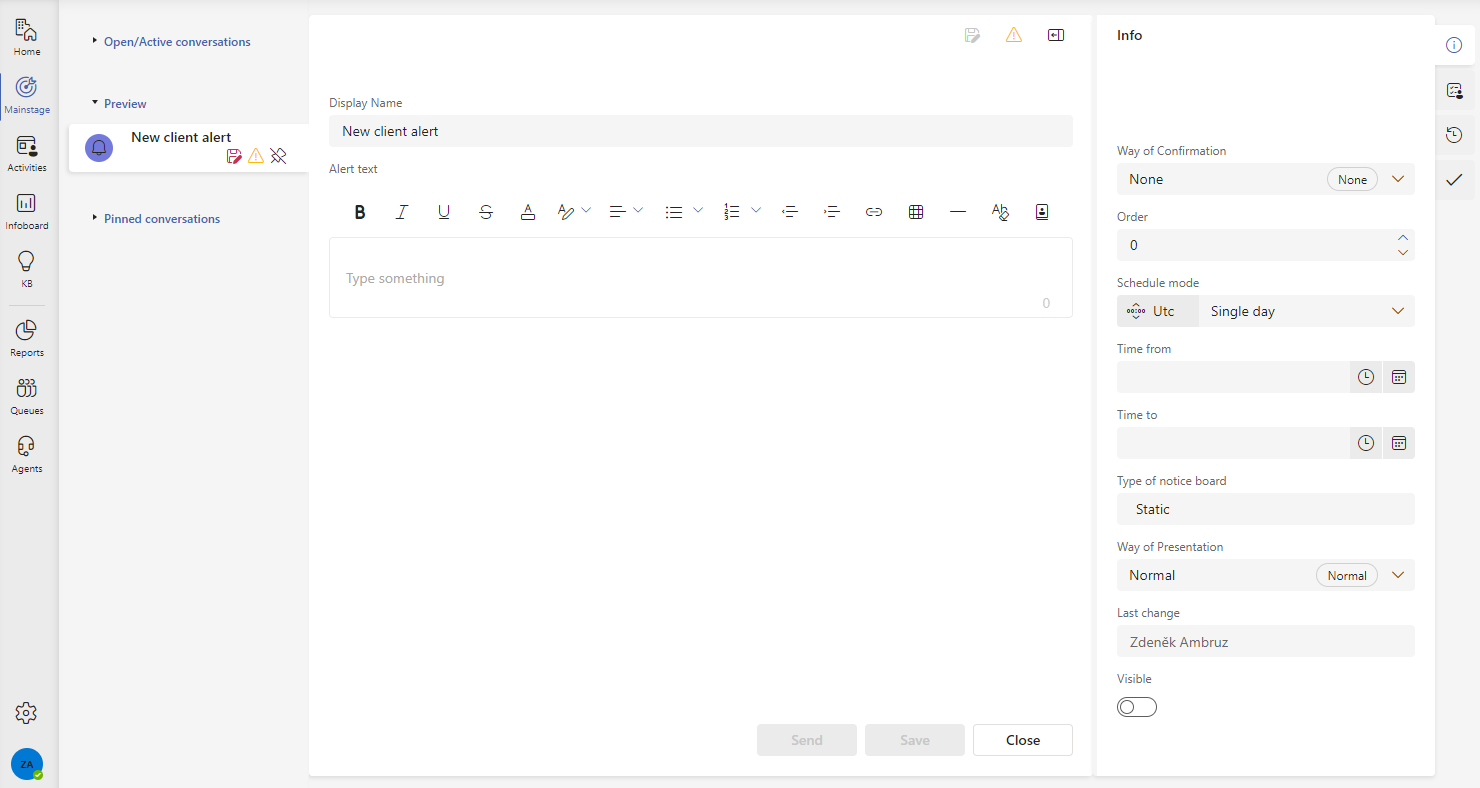
Fill in parameters on the Info subtab, which affects the behaviour of the cLient alert itself.
Way of Confirmation - client alert can require agent’s confirmation, but can be also without it
Priority - alert importance, interpreted in previews and notifications, see more at Infoboard article priority
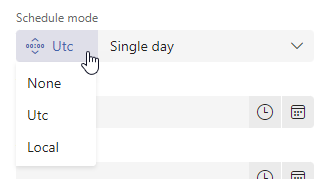
Schedule mode
Pattern for showing the alert, it relates with the Way of Confirmation item, where the alert is hidden after confirmation, but it can appear again
After selecting a particular schedule mode, more control items for mode specification will appear.
You can choose a time zone related to the inserted time.
Type of notice board -
Way of presentation - as an addition to others, it also influences the icon displayend within the alert preview

Visible - if not checked, client alert will not be visible on Infoboard’s Priority and Timeline subtabs, only on a My drafts subtab under your account
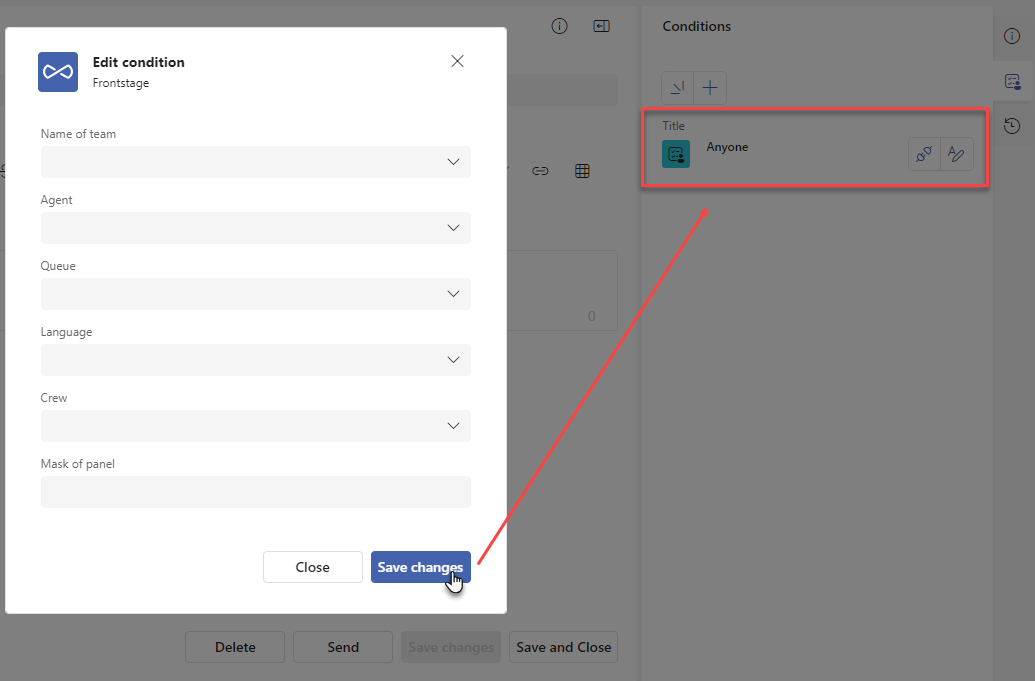
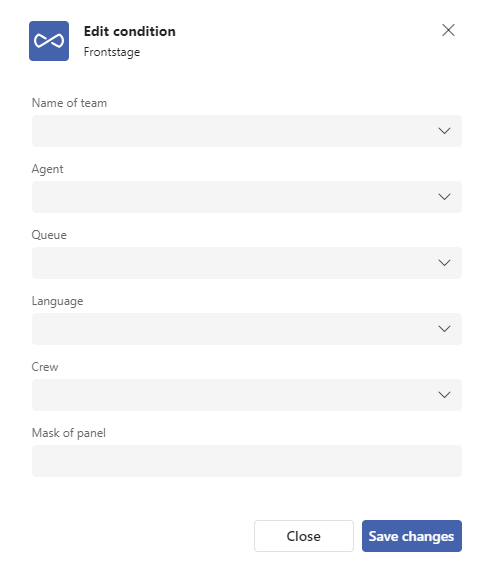
At least one valid condition has to be filled in on the Conditions subtab, otherwise the client alert will not be displayed anywhere, even when Visible checked. As a valid condition is considered even an empty one, which will result in a visibility for everyone. See more at Conditions
During the activity, you can use Save changes, when everything is saved and you remain in edit mode, alternatively Save and close, when the edit mode will be closed and preview will be shown.
Creating a template
Template can have all the parameters as a common client alert, data from the form, Info and Conditions subtabs are coppied to a newly created alert.
To create template from any client alert, open the Info subtab and adjust the Type of notice board parameter to a “Template” value. It will be available to other users after saving.
All of the templates, which you have rights to, can be seen on Infoboard, Templates subtab.
Conditions
They act as filters for users who can see the client alert. So, if you for instance insert value “Sales” for the Crew parameter, only given group members will be able to see it.
Multiple parameters of a single condition will evalueate in a way, that all of the parameters must match, in order to display the alert to the agent (logical AND operator)
When multiple conditions are inserted for an alert, agent must match at least one of them, in order to display the alert for him (logical OR operator).
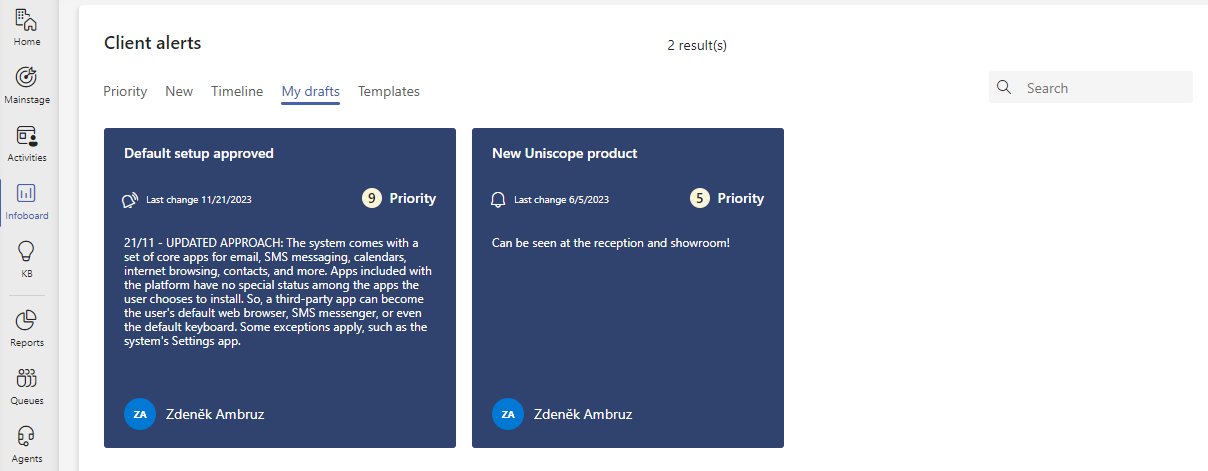
Subtab My drafts
It’s the Infoboard’s subtab. All your saved, but not visible to others alerts will be stored here, which means Visible is not checked on them. See more at Creating a Client alert.
KB (Knowledge base)
The contact centre’s knowledge base is a centralised repository of information about common customer support problems. It contains step-by-step guides for solving the most common problems, documentation for agents on handling specific situations, and training materials. The articles embedded here contribute to quick problem resolution.
You can create the articles from Start a new conversation and add information section, presuming you have the appropriate level of EditKbArticle role.
To edit the article, click on it either from the “Search” list or the “Pinned” list, Edit button is located in the lower right corner. When used, the form will switch to the editor, where you are able to do:
Adjust and format the text, including the title
Add/Remove the article tags (tags can be defined via KB Tags)
Change the metadata in the Info subtab
Note
The Key, located in the Info subtab is governed by individual EditKbArticleKey role.
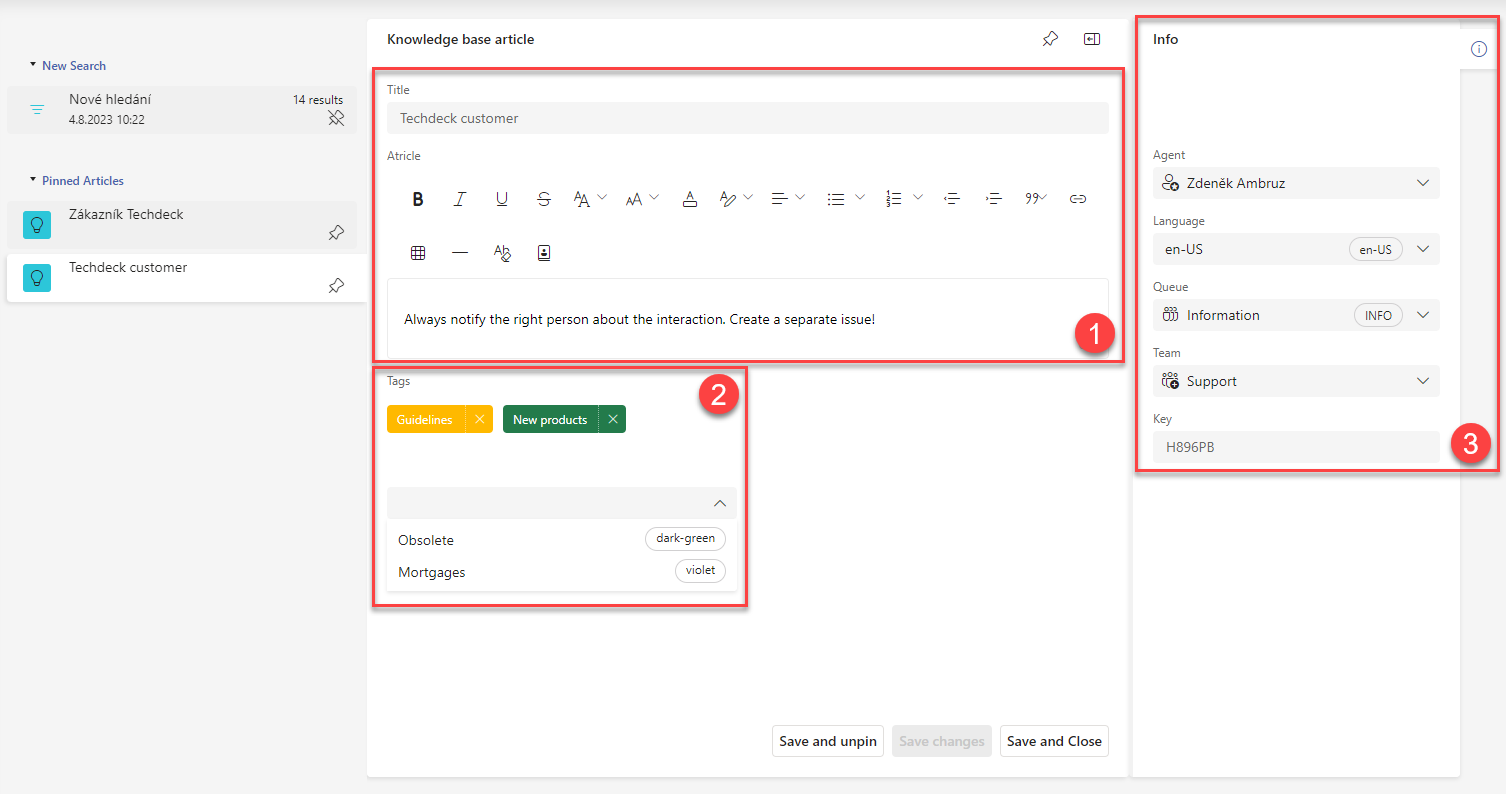
The editor contains 3 buttons:
Save and Unpin - saves the changes and unpins the article from you list, changes are published for other agents
Save changes - saves the changes, which are not published yet, the article remains in an editor mode
Save and Close - saves the changes and publishes them for other agents, the article remains pinned and editor is closed
Note
The indication, whether the changes are already published or not is also an icon, which changes its colour. Icon  is for published article, icon
  for edited article.
Queues
This tab is used to display statistics from the queue view, i.e. from an external perspective. It is a data cube where you can explore the data by focusing on a specific communication channel, queue/group, etc.
Layout
[1] - Queue filter
[2] - Dashboard switch - Available dashboards according to the
ShowQueueTCrole.[3] - Active dashboard
[4] - Communication channel filter
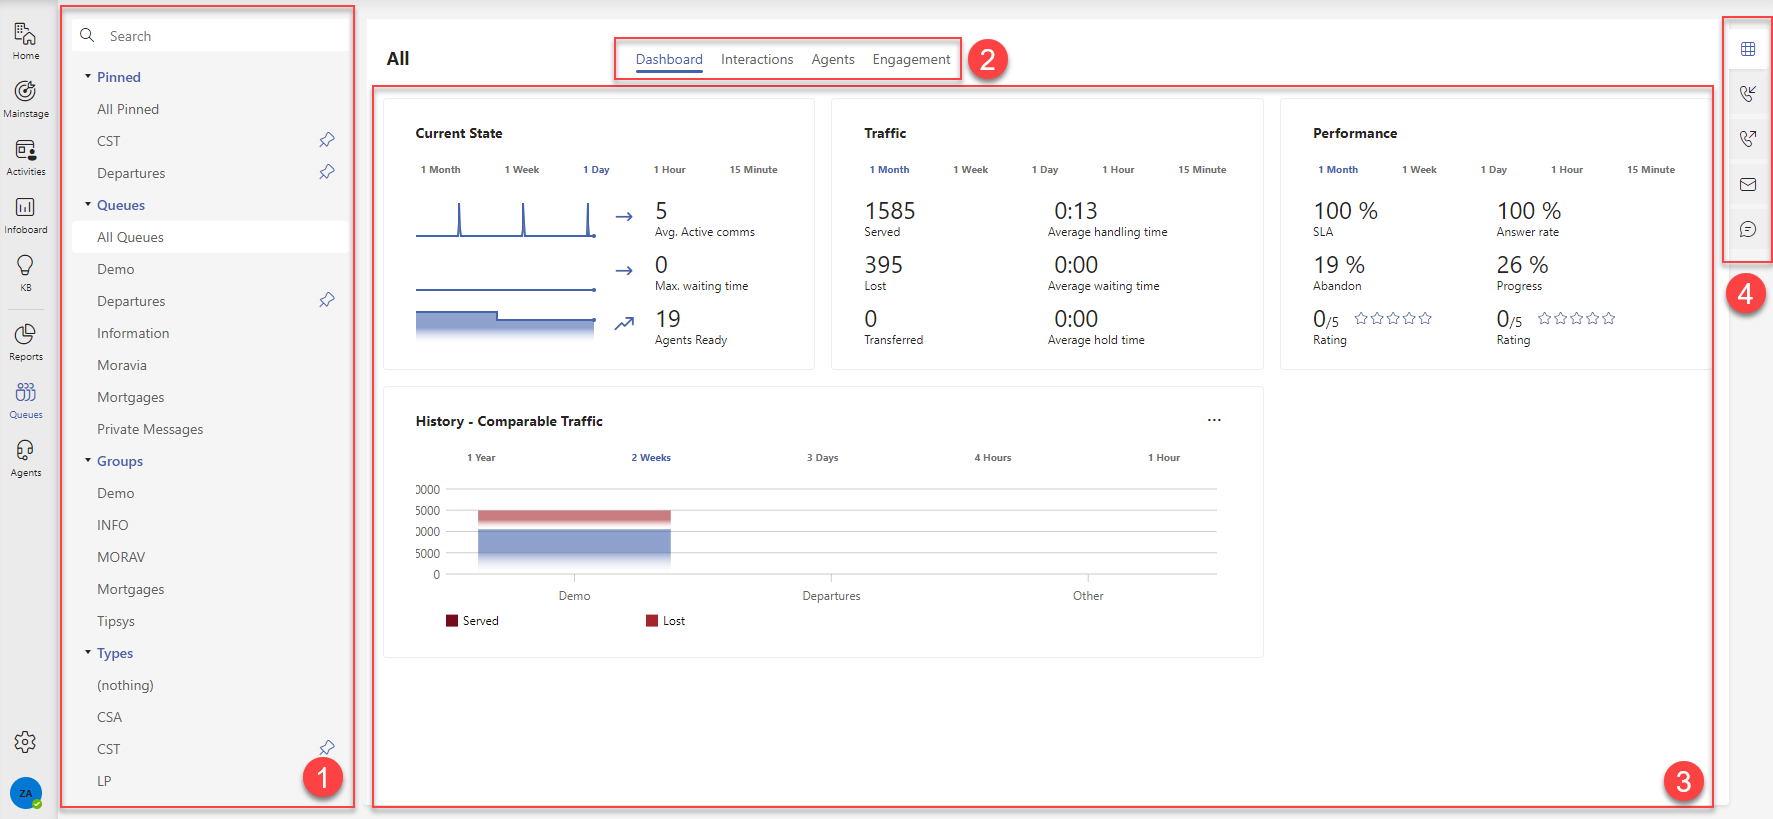
Queue filter [1]
Data from which the active dashboard will be rendered [3]. Only one item can be active at a time, i.e. you are rendering data of a specific queue or group of queues or queue types. Dashboard [3] is updated after selection. You can pin frequently used records, see. Pin/Unpin.
Important
For Groups and Types the first 20 records from the database are displayed. For Queues it is the first 200 records, higher numbers are indicated by the More entries, use search warning. The searchbar is at the very top of the list.
Communication channel filter [4]
The second filtering of the data cube, where you select a specific channel from the data of the selected queues [1] for the active dashboard. You can select one specific channel or all of them at once. View [3] is updated after selection.
Overview
This is the first type of view that plots data in multiple tiles, combining graphical and statistical representations of the data.
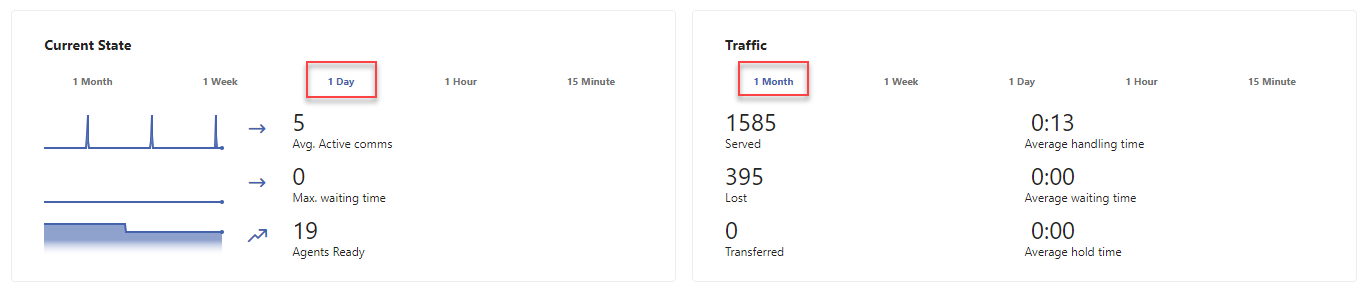
Each tile has several intervals by which you can view the data, click on the interval name to activate it. The intervals of each tile may differ.
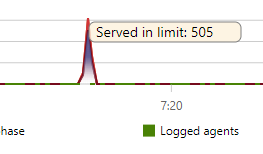
The graphs show an explanation of the plotted data when the cursor is hovered over.
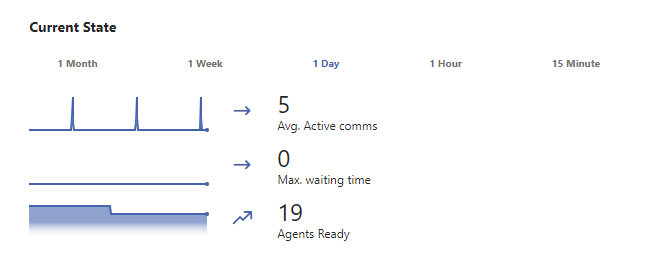
Current state
A tile showing the current load status. All data relative to the selected interval.
Avg. Active comms - count of the active communications
Max. waiting time - the longest recorded wait time
Active agents - count of agents with appropriate skills and engagement for for filtered queues, in
ReadyorPostCallPausestatus
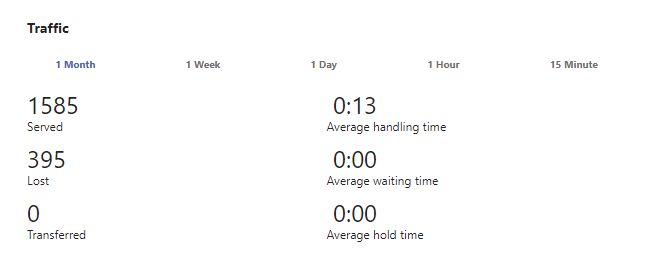
Statistics
Average handling time - the average of the range from Receive time to End time of the call when:
Accept Time - depending on the communication channel can be
AnswerTimeorAcceptTimeEndTime - according to the event it can be
EndTime,PcpTimeorAppResultTime, if more than one of these values is valid for one record, the latest one is taken
Average Waiting Time - the average of the range from Enqueue Time to Accepting Time when:
Enqueue Time -
EnqueueingTimeAccepting time - depending on the communication channel can be
AnswerTimeorAcceptTime
Average hold time - average of
HoldDurationtime values

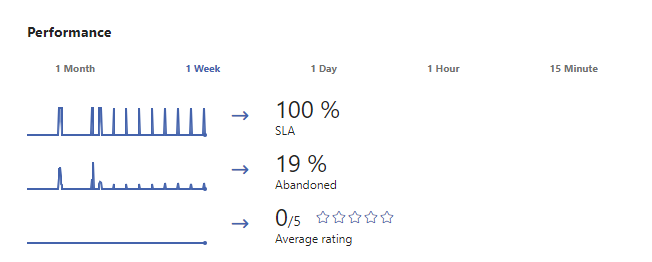
Performance
The tile has two types of views, based on the channel filter [4].
For a specific channel:
SLA - Communications served in limit / All served [%] (SLA tab)
Abandoned - Communications lost in queue / All communications in queue [%]
Average rating
Note
Especially for the channel “Outbound calls” the first two tile values change to:
Answer rate - Outbound answered calls / Dialed calls [%]
Progress - Outbound answered calls / Queue length [%]
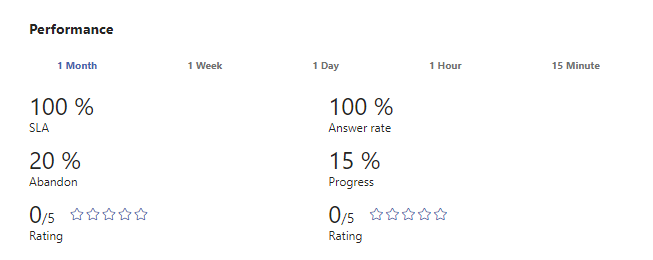
For all channels:
SLA - Communications served in limit / All served [%] (SLA tab)
Abandon - Communications lost in queue / All communications in queue [%]
Rating - for inbound communication
Answer Rate - Incoming Answered Calls / Dialed Calls [%]
Progress - Outbound Answered Calls / Queue Length [%]
Rating - for outbound communication
History
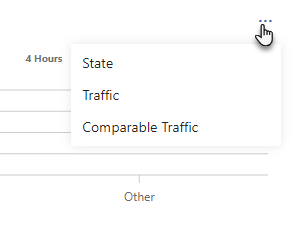
The tile allows graphical evaluation of data over a longer time period. It supports three types of graphs, which can be switched using the menu in the upper right corner of the tile.
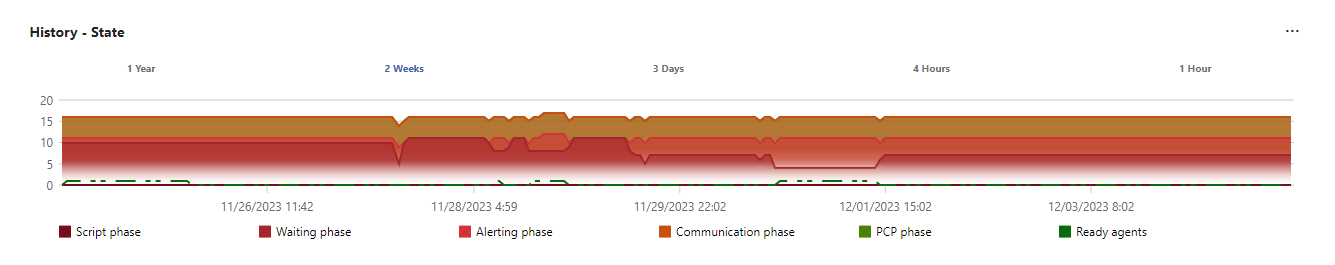
Status
Comparison of the number of communications according to their phases at a given moment.
Script - IVR/IMR/ICR
Waiting - waiting queue
Alerting - alerting or waiting for accepting
Communication - ongoing call or active chat (including “answering” phase for messages)
PCP - PCP
Ready - agents with proper skills and engagement for filtered queues, in
Readyor PCP state
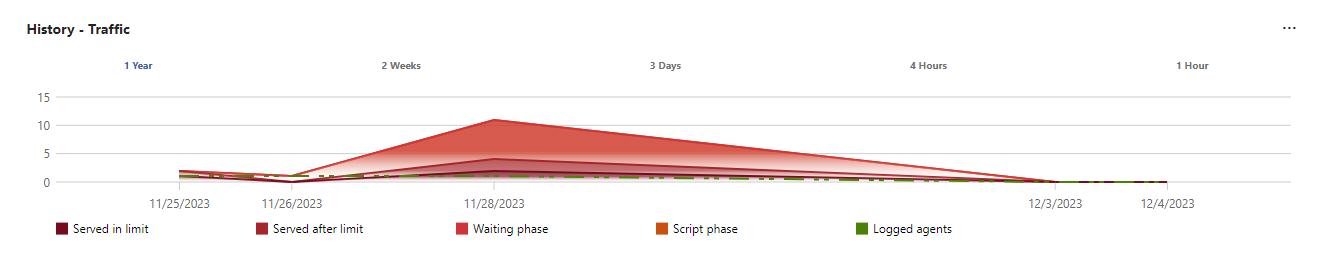
Traffic
Comparison of the number of communications according to their handling at a given moment.
Served in limit - picked up/answered within limit
Served after limit - picked up/answered after limit
Waiting phase - lost in the waiting queue
Script phase - lost in IVR/IMR/ICR
Logged agents - agents with appropriate skills and engagement for filtered queues that are logged in (
Ready,PCP,Pause)
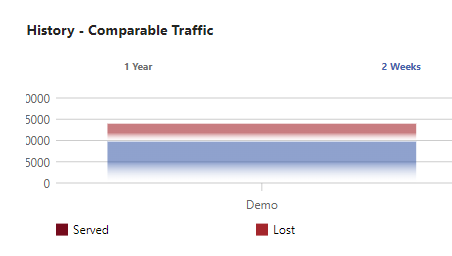
Comparable traffic
Counts of served and lost communications divided by filtered queues. The graph shows the ten busiest queues. If there are more than 10 queues in the system, a summarizing column “Other” is displayed, which combines the data of the remaining queues.
Interactions
The view shows a list of communications, filterable by queues and communication channels. This gives you a comprehensive view through which you can manage the type and topic of communications you are interested in at any given time in real-time. It includes a set of action buttons that you can use to change or enter the parameters of a communication.

Available columns
Time UTC - Time the communication was queued for processing
Channel - An icon indicating the type of communication, such as email, call, etc. Displayed only if the channel filter is set to “All”.
ID—The Communication identifier. It can vary depending on the type of communication and the filled-in data.
Contact - If the communication has a contact assigned to it, its name is listed here. When the communication editor is opened, it can be found in the Contact subtab.
Status - Status of the communication in terms of queued processing:
“Predictive” - waiting for distribution after dialing by predictor and receiving at collector
“Active” - waiting for distribution in active mode (communication in the channel is already running, incoming calls, forwarded calls, chat)
“Normal” - waiting for distribution in passive mode (scheduled outgoing calls, messages)
“Waiting” - waiting for distribution in active mode in the waiting queue (calls or chat), basically corresponds to the state “Active”
“Transfer” - distribution to the agent
“Processing” - live agent processing (conversation, writing)
“PostProc” - communication is over; waiting for the release of the agent
“Blocked” - distribution is blocked (e.g., when a communication is part of an outgoing campaign that is no longer active); these communications can be removed from the queue
Note
The names of the states and their icons can be modified in the
LiteralLookupdatabase table, valueLiteralGroup = 32.Actions
 - Set you as the agent that will handle the communication
 - Brings up a window to change the communication metadata. For example “Queue”, “Language”, levels of “Skills”, “Knowledge” and “Priorities”, etc. A different set of metadata will be available for each type of communication.
 - Brings up a window where you can change the current agent.
 - If it is an active call, you can listen to the communication in real-time.
 - If it is an active call, you can send a hint to the agent.
 - If it is an active call, you can enter the call as an additional party.
Important
To use actions, you must have
ShowAgentTCpermissions at least at theAllowWritelevel. To use active call buttons, you must haveInterventionpermissions.Duration - The time the communication spent in the processing queue.
Agent, Language and Queue - List of values assigned to the communication. When its editor is opened, they can be found on the Info subfolder.
Skill - The ideal level of the agent’s skill to handle communication positively.
The value setting is performed by input rules, e.g. see. Inbound Calls
For agent settings, see. The Skills tab
Proficiency - The ideal level of the agent’s knowledge to handle the communication positively.
The value setting is performed by input rules, e.g. see. Inbound Calls
For agent settings, see. The Proficiencies tab.
Priority - Communication priority set on the Info subtab
Note
The values for skill, proficiency and priority are represented by a graphical matrix -

The records can be sorted by the values in the columns, the sorting is activated by clicking on the column name. Columns with a  icon next to their name support filtering by a predefined set of values. Click on this icon to display the filtering options:

To open the communication editor, double-click on the display name in the ID column.

Note
The same control logic applies to the other available views.
Agents
The view shows a list of agents, filterable by queues and communication channels. It gives an overview of agents’ current status, workload, and engagement. The view also includes a set of action buttons that allow internal communication with agents.

Available columns
Agent - Name of the agent.
Team - The agent’s team.
Status - Its current status. Click here to expand the list of all statuses, and you can switch it. For the definition of statuses, see. Agent statuses.
Status Duration - The time the agent is in the state specified in the Status column.
Actions - options to interact with the agent:
 - Create a message board post with a pre-made rule so only the agent can see the post. The post will be shown as a notification in the application. For more on this topic, see. Infoboard.
 - Create a task assigned to the given agent.
Important
You must have
ShowAgentTCpermissions at least at theAllowWritelevel to be able to use actions.Communication - This column represents the workplace where the agent is logged in. It shows you the workstation number, what communication channels are enabled on it, and how many active communications the agent currently has queued.

If a call is in progress or being distributed to an agent, the voice channel icon is accompanied by a flag indicating the direction of the call.
 - Outbound call
 -Inbound call
Workplace state - Combination of workstation and call status in graphical representation:
 - A workplace failure or agent is not logged on a specific workplace, but emails are distributed to him/her
 - Logged in at the workplace, and the line is free (no communication is taking place)
 - Logged in at the workplace and is currently being offered a call
 - Ongoing call
 - Outgoing call offered to the agent to dial
 - Outgoing call ringing or in progress
Engagement
The view is primarily used to set up the agent engagement for the queue and channel, i.e., pay primary attention to the Enabled column. For more on engagement, see. Project skills.

Available columns
Agent - Name of the agent.
Status - Current agent status.
Status Duration - The time the agent is in the state specified in the Status column.
Enabled - Engaging an agent in a specific queue within a communication channel.
The indication will change based on the filters you select for the channel and queue because the agent usually has different current wiring for each communication channel and queue
Click the icon to change the agent enable/disable value for the filtered channel and queue! The control principle and possible combinations are described in the agent section.
If you have a communication channel set to “All” or a queue set to “All Queues”, an ambiguous condition may occur where the agent may have different wiring values for partial queues and channels, but only one indicator column is available. For this reason, two more intermediate states may appear, indicated by icons:
 - Agent does not have all filtered combinations enabled (e.g. by himself), and even across supervisor set wiring, there is no match everywhere
 - The agent has all filtered combinations enabled (e.g. by himself), but there is no match everywhere across the supervisor-set wiring
Knowledge Level - The agent level for a specific filtered queue and communication channel. In the case of bulk filters, such as “All” channels or “All Queues”, a range in the form “Min - Max” will be shown.
Actions - options to interact with the agent:
- - Create a message board post with a pre-made rule so only the agent can see the post. The post will be shown as a notification in the application. For more on this topic, see. Infoboard.
- - Create a task assigned to the given agent.
Important
You must have
ShowAgentTCpermissions at least at theAllowWritelevel to be able to use actions.Workplace - This column represents the workplace where the agent is logged in. It shows you the workstation number and what communication channels are enabled on it.
User settings and options
The application options are the same for you as for agents, see. application settings. Settings relevant only for your role are under the tab Supervisor.
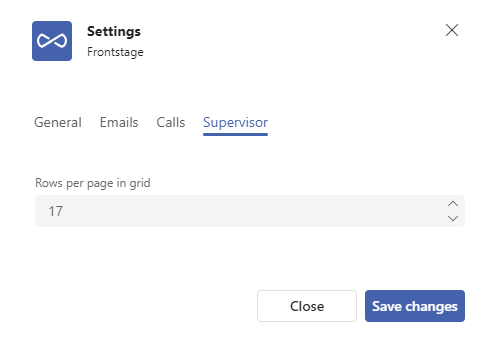
Settings:
Row per page in grid - the value specifies the number of rows for the grids that are displayed on the Queues and Agents tabs