Traffic models
Traffic models are a powerful tool to make sure that you have enough agents to handle the planned traffic. By comparing traffic history, scheduled shifts, and calculated estimates of agents needed, you can easily see that you probably need fewer or more agents than you planned.
Concepts and overview
Traffic model description
Traffic model is a simple data structure into which you collect the number of interactions made and the average length of service (response time) over a period of time (e.g. 15 minutes) and channel (e.g. all inbound calls). FrontStage can calculate the estimated agents needed for the required service level.
Collecting and closed model
A collecting traffic model actively stores data. It is practical to run one or more collecting models as soon as you deploy FrontStage to get enough historical data. However, you can import traffic from a CSV file at any time.
You can pause the collecting model. However, since this the model collects only three pieces of data for each measurement interval (sum of interactions, average service duration and, optionally, estimated number of agents needed), you can let the collecting model run for many years without having to worry about anything.
The collecting model has no end and more and keeps adding more data over time. For analysis purposes, it is necessary to create a closed model with fixed last measured data.
Caution
A closed model will always be exactly a week (seven days) long. When you create it, you copy (“close”) a week of data from a collecting traffic model or different closed model. You can create any number of closed models from collecting and other closed models.
The period copied to the closed model should be as representative as possible. For example, summer or holiday periods usually do not represent typical call center traffic.
Collection interval
The collection interval setting depends on the nature of the channel. A typical value for channels, such as calls requiring immediate response, is 900 seconds (15 minutes).
For less-favored channels such as e-mail, when the agent responds only when they are not busy with calls, 3600 seconds (1 hour) is usually sufficient. However, the moment when the request is actually addressed (the e-mail message is marekd as received) may occur several hours later. The resolution, and hence the response time recorded in the statistics (determined as the time between its designation as received and then as resolved), although short, is rarely finished within one collection interval.
Therefore, it is also possible to set a collection delay time after real time for the traffic model, with its typical value being 86,400 s (1 day). This value tells you how far in the past to look to establish the response time. The response time will be correct in the model statistics if the agent managed to process the request within the set value (e.g. 1 day).
Model statuses
The collecting and closed models are closely related to statuses that you can change in FrontStage administration.
Statuses that a model may have:
Collecting– Set this status to start data collection.Paused– Set this state to pause the collecting model.ModelCopy(copying) – A temporary model status while the model is being copied to another model; once finished, it will change toModelDraft.ModelCalculating(calculating) - A temporary model status during the calculation of an estimated number of agents needed for the specified service level.ModelDraft(draft) andModelApproved(approved) - After copying a representative period from the collecting model, the new closed model will be have theModelDraftstatus. You can set theModelApprovedstatus manually. Interactive charts show both the approved model and the draft model.
Tip
If you see a model in the temporary status of ModelCopy or ModelCalculating in the administration interface for an extended period of time, it may indicate that there was an error during the operation.
Limiting collected data
When creating a traffic model, you decide for which channel you want to collect data. They do not have to be just real channels (like inbound voice, SMS) or virtual channels like all voice.
For the selected channel, you can only track data for a specific project. If the project is not filled out, it means that the model will contain channel data regardless of the project.
Predictions
In a closed model, you can calculate an estimate (prediction) of the agents needed for the required service level, which you specify before the calculation.
Important
A collecting model cannot have any estimate, while a closed model can have an estimate if you let it be calculated. However, it does not make sense to have it without an estimate because then there is nothing to display in interactive charts.
The Erlang C algorithm is used to calculate the estimate.
Editors with interactive charts
You can analyze closed models with traffic estimation using two editors with interactive charts – a model-specific editor and a plan-estimate comparison editor.
A great part of the editor interface is occupied by bar and line charts. The meaning of the bar chart is different for both editors due to their different purposes; nevertheless, the line chart always shows an estimate (if calculated for the model).
Workflows
You can do all of the following in FrontStage administration under .
Initial settings
We recommend starting and running one or more collecting models as soon as you start deploying FrontStage.
Click on Add item below the model list.
Complete the form.
Choose a suitable name, select a channel; you can limit collection to a project.
The Interval duration [s] field is used to specify the time between collections in seconds. A typical value for calls is 900 seconds (15 minutes) and for channels like e-mails it is 3600 seconds (1 hour).
For channels like e-mails, enter Collection delay time after real time [s]. Usually 86,400 s (1 day). At the beginning of this chapter, you will find an explanation of this field.
It is important to set the status to
Collecting.Enter when the nearest first collection should take place.
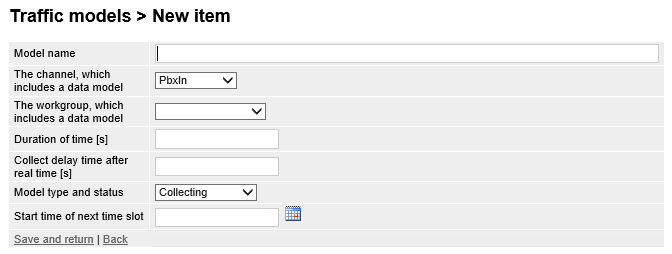
Save the collecting model by clicking on Save and back.
Another possibility to get the traffic history immediately is to import it from a CSV file, e.g. from the original call center or another system.
Creating a closed copy
You can select a one-week period from any collecting or other closed model, and the one-week period will be copied to the new closed model.
Open the collecting or closed model and click under the form on the right on Copy of traffic.
Complete the form.
You must specify a period of one week, starting with Monday 0:00 and ending Sunday 23:59.
Optionally, you can edit it before copying the actual value. You can modify the number of interactions or average service duration by multiplying the actual value by % or adding an absolute number.
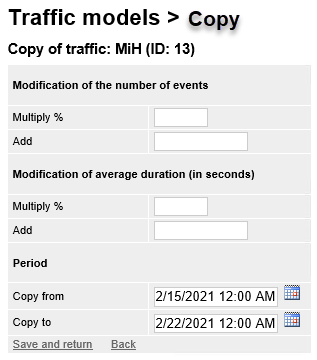
To start copying, click on Save and back.
You can find the new model in the list of other models. It is also accessible on the source model below the form in the list of Model exports and copies.

Estimate calculation
After you create a closed model by copying, you usually calculate the estimate (prediction) of the agents needed based on the required service level.
Open the closed model and under the form on the right, click on Prediction calculation.
Complete the form.
Enter the service level in % (e.g. 80).
Enter a service limit in seconds (e.g. 30).
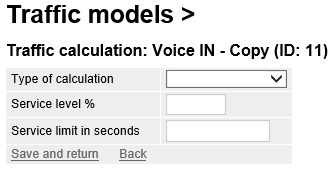
To start the calculation, click on Save and back.
You can monitor the calculation status in the list of Model exports and copies below the form. After some time the action should be in the
OKstatus. (You must refresh the browser page to update the status.)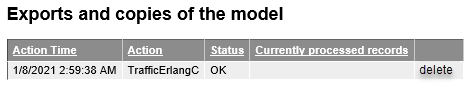
Exporting to CSV
Sometimes it may be useful to export the traffic model data to a CSV file that you will analyze, for example, in Excel.
Open the closed model and under the form on the right, click on Export traffic.
Complete the form.
You are required to enter a separator (usually
,/comma/).Convert to local time changes the time zone and name of the first column in the output file. In this case, the name of the first column will be
Start, notStartUtc. The time zone will be that of the server, not UTC+0.Select an appropriate Encoding. Enter the same when you import the file somewhere.
Select a from-to period to be exported. The dialog box offers the entire model period as default values.
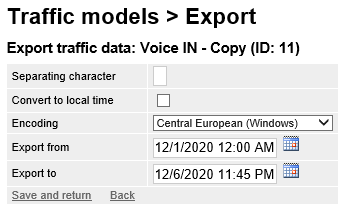
To start the calculation, click on Save and back.
You can monitor the calculation status in the list of Model exports and copies below the form. After some time the action should be in the
OKstatus and offer a link to Download the file. (You must refresh the browser page to update the status.)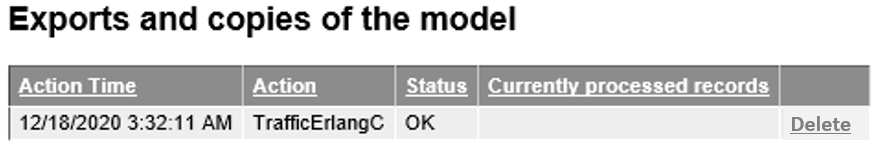
CSV file format for import and export
An exported or imported CSV file contains four columns.
Column
StartUtc– The time of data acquisition in UTC+0, OR columnStart– If you ticked the use of local time when exporting/importing.Column
Total– Shows the total number of interactions per interval.Column
Duration– An average interaction service duration in seconds.Column
Servants– An estimated number of agents (if calculated), otherwise blank.
CSV file example:
StartUtc,Total,Duration,Servants
2017-12-31 23:00,4,300,3
2017-12-31 23:15,5,300,4
2017-12-31 23:30,4,300,3
2017-12-31 23:45,5,300,4
2018-01-01 00:00,4,300,3
2018-01-01 00:15,4,300,3
2018-01-01 00:30,3,300,3
2018-01-01 00:45,4,300,3
2018-01-01 01:00,5,300,4
2018-01-01 01:15,4,300,3
2018-01-01 01:30,5,300,4
2018-01-01 01:45,4,300,3
Importing from CSV
In addition to enabling one or more collecting models, you can import model data from a CSV file.
On the main screen, navigate to the list of Traffic model imports and click on Import new model.
Complete the form.
Choose the same separator and encoding values that you used when exporting.
Select a channel and optionally a data project.
Time data in the file is in local time changes the time zone and name of the first column in the output file. In this case, the name of the first column will be
Start, notStartUtc. The time zone will be that of the server, not UTC+0.
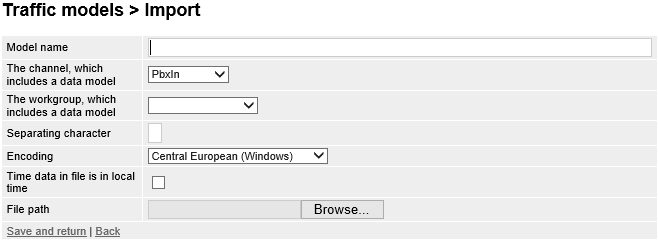
To start importing, click on Save and back.
You can monitor the import status in the list of Model exports and copies below the form. After some time the action should be in the
OKstatus. (You must refresh the browser page to update the status.)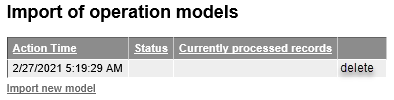
Traffic model editor
The first editor displays or modifies a particular traffic model. It compares the number of interactions on a given day with the estimate, if calculated.
Opening the editor
You can access the model editor either from the administration interface or by opening a second editor that compares the plan and the estimate.
User interface overview
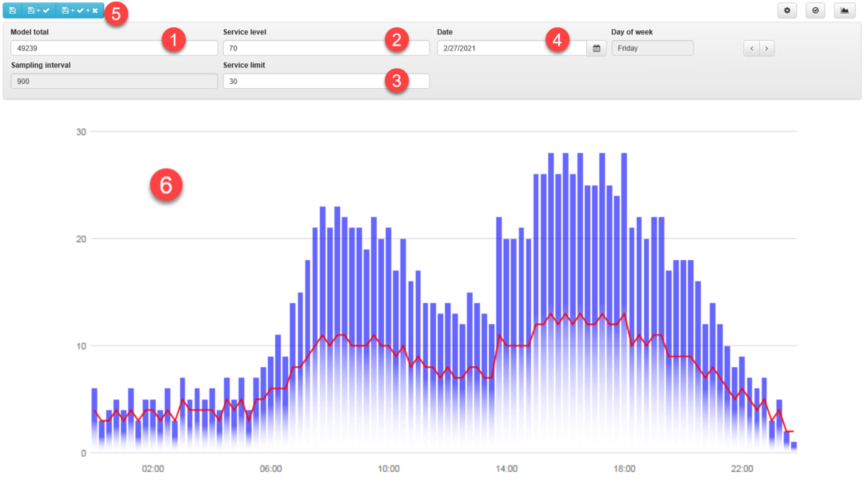
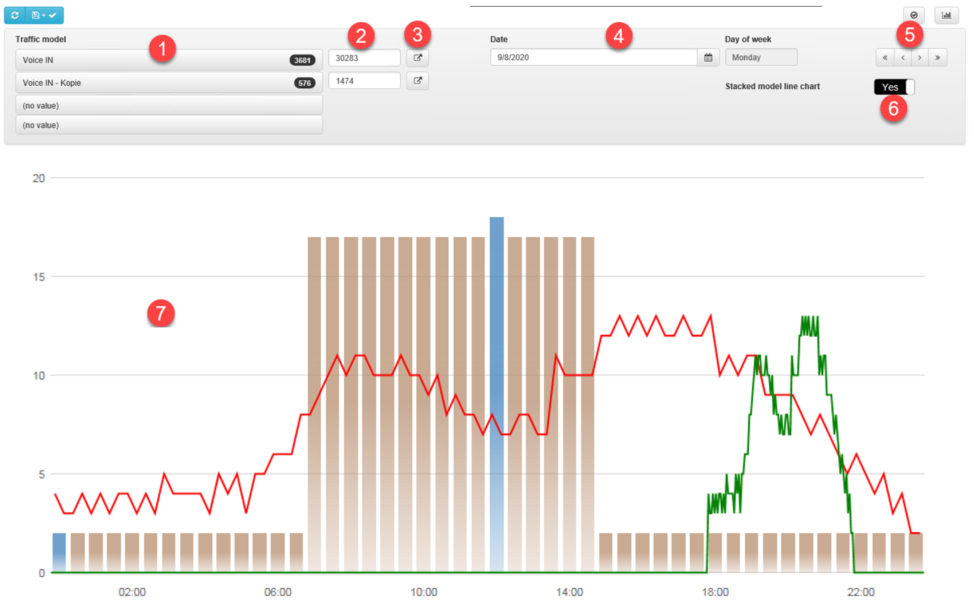
Main elements of the traffic model editor:
[1] You can see or edit the total number of interactions in the model in this field. When saving changes, the new number is evenly distributed throughout the week (durations of all closed models).
[2], [3] If an estimate has been calculated for the model, you can see for which service level it was created. It can be edited by entering new values, saving and recalculation ([5]).
[4] By selecting the date or using the arrow keys, you can look at another day of the selected model week. You can enter any date and this day of the week will be displayed.
[5] Whenever you change the number of interactions ([1]) or service level ([2] and [3]), you need to edit the model using the buttons above that only save, save and recalculate, or save, recalculate and close the editor.
[6] The largest part is represented by the line chart of the estimate and the bar chart of the number of interactions. You can adjust the number of interactions in an interval by dragging the column top.
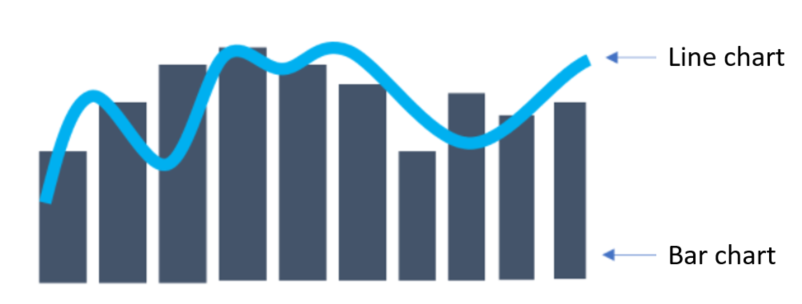
Key
Line chart – If the model has a calculated estimate, a line chart is displayed.
Bar chart – The number of interactions during the selected day.
Plan and estimate comparison editor
Another editor is used to compare the actual shift plan (bar chart) and the calculated estimate (line chart). It allows you to quickly assess whether there will be enough agents for the planned traffic load.
Opening the editor
You can usually access this editor from the main WFM page by clicking on Traffic model.
Note
You can configure the way how you open the editor and also the button location, and the screen layout may therefore vary with your FrontStage installation.
User interface overview
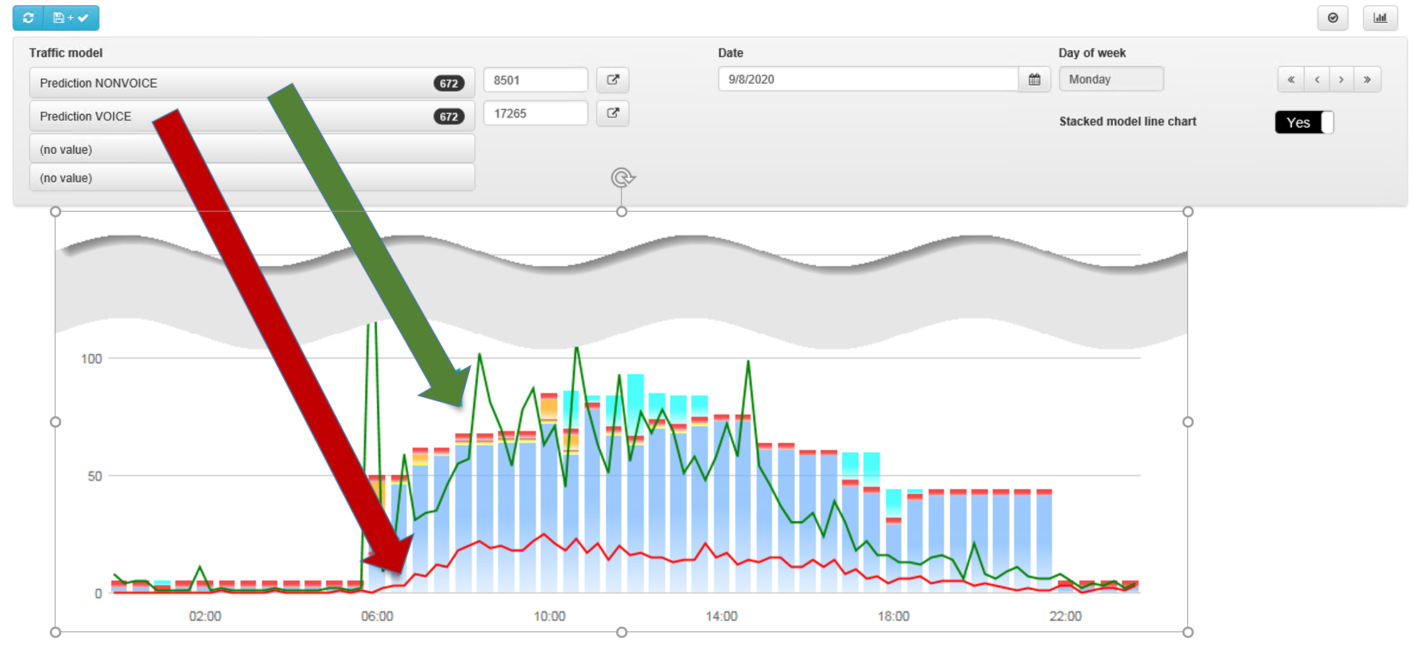
Main elements of the plan and estimate comparison editor:
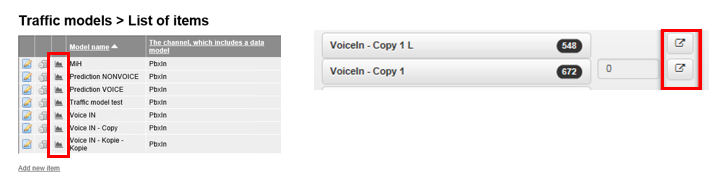
[1] The editor can simultaneously display an estimate (line chart) originating from multiple models that you select in the editor header. The drop-down list on the right in the black badge shows the total number of entries in the given model.
[2] The field next to the drop-down list shows the number of interactions on the day displayed (e.g. Saturday). If the model is not being recalculated, the value can be edited and a recalculation performed ([8]).
[3] This button opens a specific model in a separate window.
[4], [5] You can use a specific date or arrow to move forward/backward by a week.
[6] The option to select multiple models ([1]) is associated with the Stacked model chart switch, which converts the estimate chart to a stacked line chart that does not display the absolute values of each selected model but adds a value to the model in the lower drop-down list from the model in the drop-down list above it etc.
[7] The largest part is occupied by the line chart of the estimate and the bar chart of the shift plan.
[8] Whenever you change the number of interactions ([2]), you need to edit the model using the buttons above, which just save and recalculate.
Key
Line chart – If the model has a calculated estimate, it is displayed as a line chart. The editor allows you to display a maximum of 4 models at a time and, thus, a maximum of 4 line charts.
The useful Stacked model chart switch changes the displayed line chart to a stacked line chart where the values of the selected models are added together. The lowest line belongs to the lowest model selected, the line above it to the model selected in the drop-down list above the previous one.
The usual use for the stacked variant is that you select the most important channel (e.g. voice) as the lowest one, and less important one(s) over it (e.g. everything else). By comparing it to the bar chart, you will see that the most important channel is sufficiently covered. A minor overestimation/underestimation on a less important channel usually does not matter.
Bar chart – Represents the scheduled work (shifts). For the sake of clarity, the chart groups similar types of activities such as all types of absence etc. You can see the meaning of the colors that make up the column in the tooltip (if you leave the mouse cursor hovering over it).
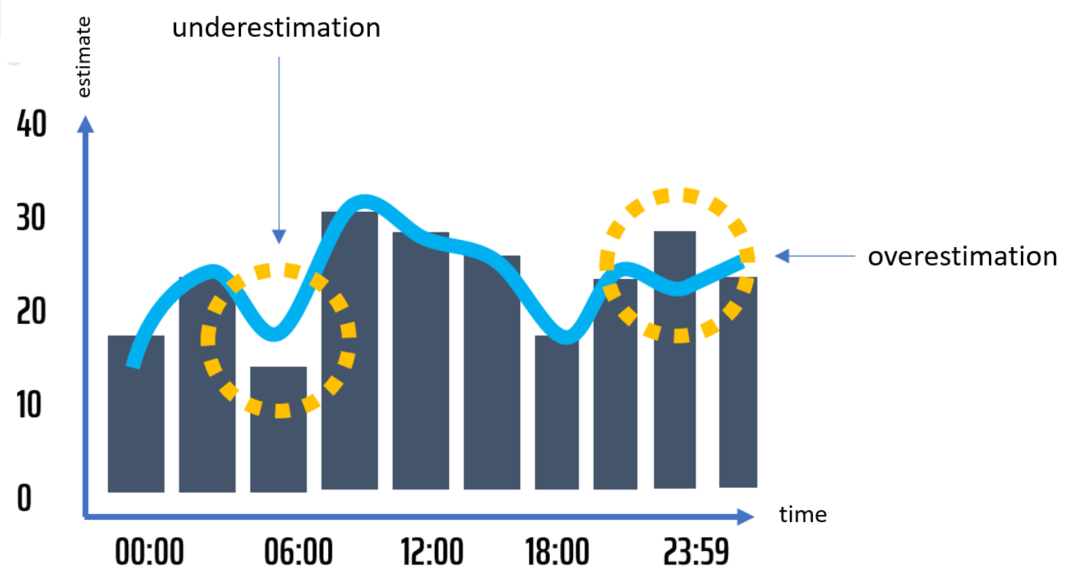
Interpretation
By comparing the shift plan and the estimate, you can easily reveal parts of the day when you have too many/few agents.
In the case of overestimating, the bar chart (shit plan) is higher than the line chart (estimated number of agents) for the same point of time (horizontal axis). In other words, you have planned more agents than are likely to be needed to meet the target service level.
In the case of underestimating, the bar chart (shit plan) is lower than the line chart (estimated number of agents) for the same point of time (horizontal axis). In other words, you have planned fewer agents than are likely to be needed to meet the target service level.
The ideal comparison of the plan and the estimate looks like the line chart (estimated number of agents) approximately copies the bar chart (shift plan). In the following illustration, most of the day is fine except the underestimated morning and the overestimated night.